March 11, 2026 a 05:08 am
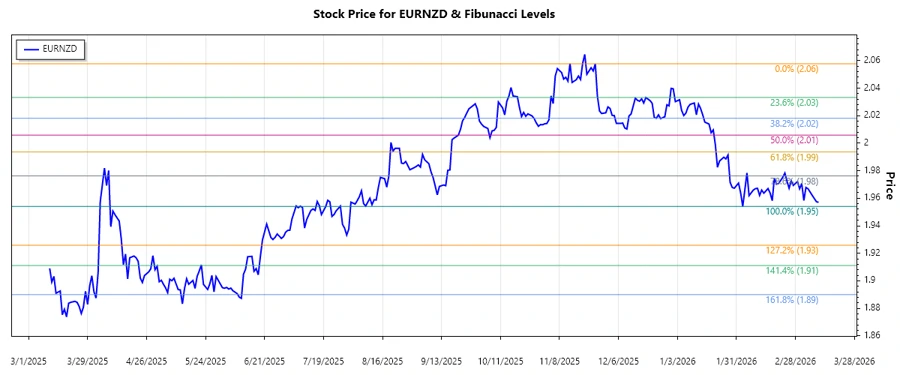
EURNZD: Fibonacci Analysis
The EURNZD market has recently displayed a downward trend, indicating challenges in the European economy compared to New Zealand. This pair has endured volatility amidst shifting global economic policies, causing traders to exhibit heightened caution. Monitoring retracement levels is crucial for investors aiming to grasp potential reversals or continuations.
Fibonacci Analysis
| Detail | Data |
|---|---|
| Trend Period | 2025-11-25 to 2026-03-03 |
| High Point | 2.05768 on 2025-11-25 |
| Low Point | 1.95403 on 2026-02-03 |
| Fibonacci Levels |
|
| Current Price | 1.957 |
| Current Retracement Zone | none |
| Technical Interpretation | The current price is below the 0.236 retracement level, suggesting the potential for further downside unless a reversal occurs. |
Conclusion
In summary, EURNZD is experiencing notable bearish pressure, remaining under the 0.236 retracement mark. While this may seem negative, it presents cost-effective entry points for those aiming to capitalize on potential reversals. However, traders should approach optimistically with caution, acknowledging that deeper losses might precede any rally. The current setup offers a balanced view for technical analysts: a vigilant watch on further trends is essential to navigate opportunities and mitigate risks effectively.