March 10, 2026 a 05:08 am
CADJPY: Fibonacci Analysis
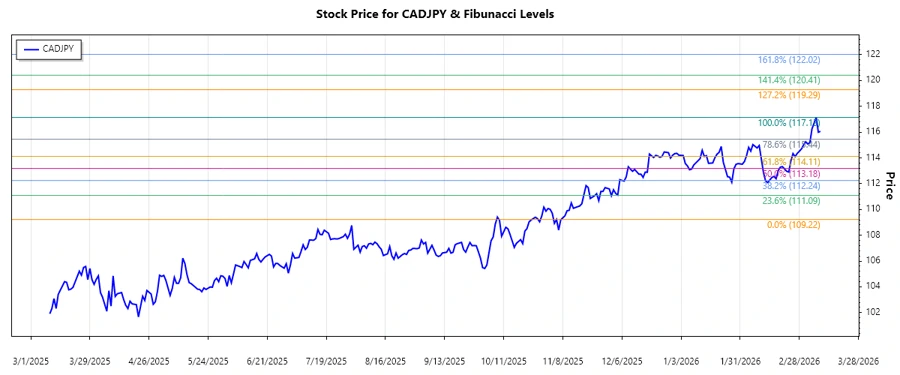
The currency pair CADJPY has shown a significant uptrend over the past months, reflecting a robust economic performance in Canada relative to Japan. This uptrend is characterized by increasing investor confidence and potential continued strength for the Canadian dollar against the Japanese yen. However, investors should remain cautious of potential reversals due to economic fluctuations and policy changes in either country. Understanding the latest trend dynamics in CADJPY illustrates potential opportunities and risks for traders.
Fibonacci Analysis
| Detail | Date/Level | Price |
|---|---|---|
| Trend Start Date | 2025-11-05 | - |
| Trend End Date | 2026-03-08 | - |
| High Point | 2026-03-08 | 117.133 |
| Low Point | 2025-11-05 | 109.221 |
| Fibonacci Level 0.236 | - | 110.664 |
| Fibonacci Level 0.382 | - | 112.512 |
| Fibonacci Level 0.5 | - | 113.177 |
| Fibonacci Level 0.618 | - | 114.842 |
| Fibonacci Level 0.786 | - | 115.737 |
| Current Price Analysis | Retracement Area | 113.177 (0.5 Level) |
| Technical Interpretation | - | The current price shows potential support at the 0.5 Fibonacci level, signaling a strong consolidation point. |
Conclusion
The recent analysis of CADJPY indicates a period of consolidation around the 113.177 level, providing a potential support zone. This could lead to a continuation of the bullish trend, given positive economic conditions are sustained. However, potential resistance at higher levels may pose challenges for further upward movements. Investors and analysts should monitor economic indicators from Canada and Japan closely, as well as any central bank policy shifts, which could impact this currency pair. The current retracement level presents both an opportunity and a risk, depending on broader market contexts. Therefore, well-informed decision-making is crucial in navigating the FX market dynamics for CADJPY.