March 12, 2026 a 11:31 am
IFF: Dividend Analysis - International Flavors & Fragrances Inc.
International Flavors & Fragrances Inc. (IFF) presents a complex dividend profile with its longstanding history of dividend payments. Despite facing challenges in maintaining a positive dividend growth in recent years, the company's commitment to shareholder returns remains noteworthy. The current market environment and operational adjustments continue to influence its payout strategy, demanding close consideration by investors.
Overview
The overview provides a concise snapshot of IFF's financial health from a dividend perspective, essential for understanding the sustainability of payout strategies.
| Key Financial Indicator | Details |
|---|---|
| Sector | Consumer Goods |
| Dividend Yield | 2.33% |
| Current Dividend per Share | 1.60 USD |
| Dividend History | 53 years |
| Last Cut or Suspension | None |
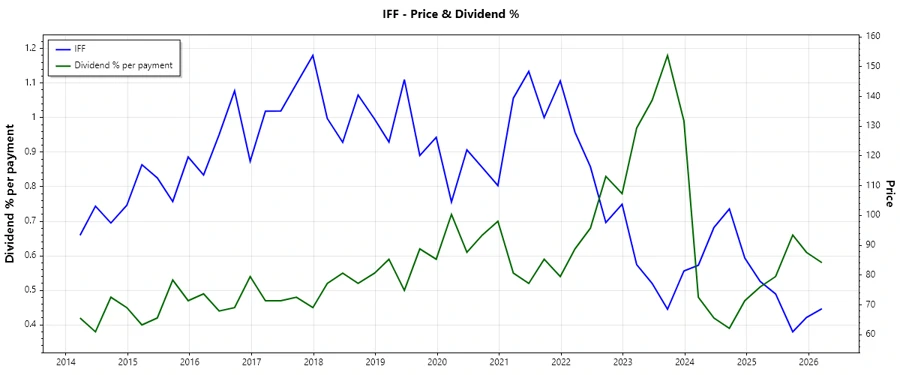
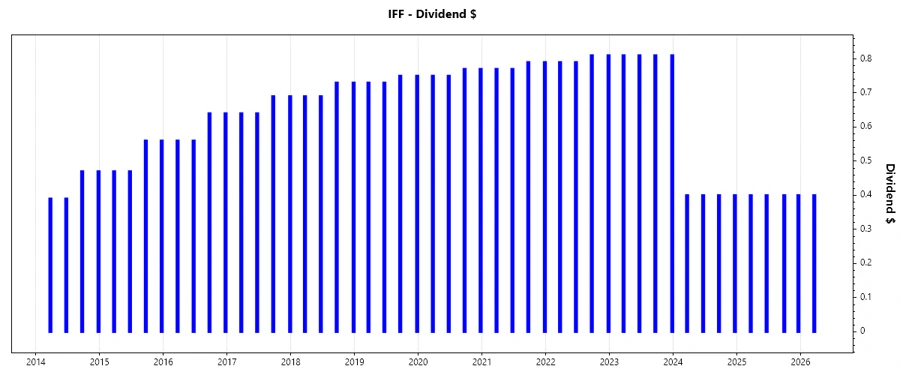
Dividend History
Understanding the dividend history is crucial as it reflects a company's long-term reliability and its potential to provide consistent returns to shareholders.
| Year | Dividend per Share (USD) |
|---|---|
| 2026 | 0.40 |
| 2025 | 1.60 |
| 2024 | 1.60 |
| 2023 | 3.24 |
| 2022 | 3.20 |
Dividend Growth
An analysis of dividend growth is a direct indicator of a company's ability to increase shareholder value over time. Current limitations in growth suggest areas for strategic improvement.
| Time | Growth |
|---|---|
| 3 years | -20.63% |
| 5 years | -12.05% |
The average dividend growth is -12.05% over 5 years. This shows moderate but steady challenges in dividend growth, possibly indicating operational or market-related headwinds.
Payout Ratio
Payout ratios offer a glimpse into the proportion of earnings and cash flow being returned to investors. They serve as indicators of financial prudence and dividend sustainability.
| Key Figure Ratio | % |
|---|---|
| EPS-based | -117.53% |
| Free cash flow-based | 159.83% |
The EPS-based payout ratio is -117.53%, indicating challenges in maintaining dividends relative to earnings, while the FCF-based ratio at 159.83% suggests potential over-extension in distributions relative to cash flow.
Cashflow & Capital Efficiency
Evaluating cash flow and capital efficiency metrics highlights IFF's ability to generate and allocate capital efficiently. It is integral to understanding its operational resilience and investment strategy.
| Metric | 2025 | 2024 | 2023 |
|---|---|---|---|
| Free Cash Flow Yield | 1.48% | 2.78% | 4.53% |
| Earnings Yield | -2.17% | 1.12% | -12.42% |
| CAPEX to Operating Cash Flow | 69.88% | 43.74% | 34.95% |
| Stock-based Compensation to Revenue | 0.63% | 0.67% | 0.57% |
| Free Cash Flow / Operating Cash Flow Ratio | 30.12% | 56.26% | 65.05% |
While the company's free cash flow yields and operating ratios suggest positive capital uses, volatility in earnings yield and capital expenditures relative to cash flow may indicate strategic adjustments are needed.
Balance Sheet & Leverage Analysis
Analyzing leverage ratios and balance sheet strength reveals insight into IFF's financial stability and risk profile, pivotal for assessing debt management strategies and liquidity positions.
| Metric | 2025 | 2024 | 2023 |
|---|---|---|---|
| Debt-to-Equity | 46.99% | 69.34% | 74.07% |
| Debt-to-Assets | 26.04% | 33.56% | 34.94% |
| Debt-to-Capital | 31.97% | 40.95% | 42.55% |
| Net Debt to EBITDA | 7.78 | 5.73 | -10.16 |
| Current Ratio | 1.42 | 1.84 | 1.67 |
| Quick Ratio | 0.82 | 1.32 | 0.97 |
| Financial Leverage | 1.80 | 2.07 | 2.12 |
Debt metrics indicate a strong reliance on leverage, with current and quick ratios highlighting potential liquidity constraints. An assessment of these figures is crucial in evaluating long-term financial health.
Fundamental Strength & Profitability
Assessing core profitability metrics illuminates IFF's ability to generate revenue efficiently relative to expenses and the capital deployed in operations.
| Metric | 2025 | 2024 | 2023 |
|---|---|---|---|
| Return on Equity | -2.64% | 1.75% | -17.56% |
| Return on Assets | -1.46% | 0.85% | -8.28% |
| Margins: Net | -3.43% | 2.12% | -22.35% |
| EBIT | -1.68% | 5.08% | -18.63% |
| EBITDA | 7.15% | 13.92% | -8.68% |
| Gross | 30.95% | 35.91% | 32.07% |
| R&D to Revenue | 6.37% | 5.84% | 5.54% |
IFF's fluctuations in returns and margins underscore areas requiring operational optimization. Focused efforts on enhancing profitability through strategic initiatives can drive shareholder value.
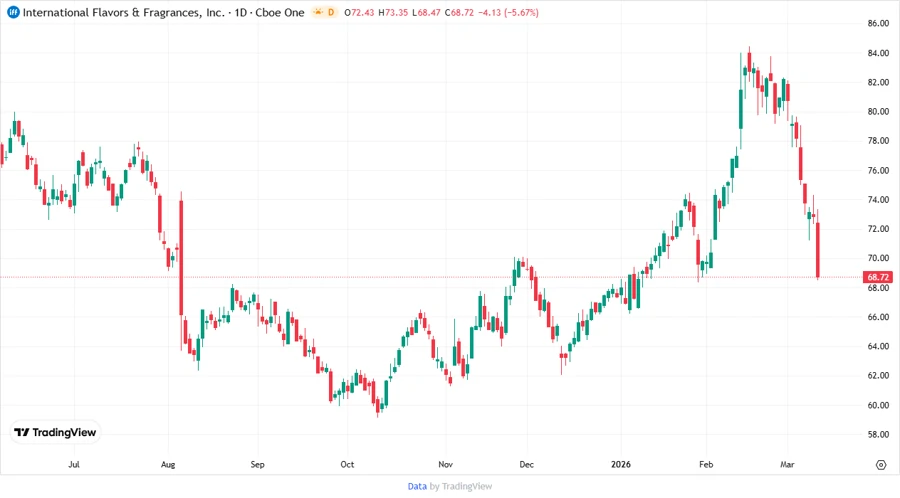
Price Development
Dividend Scoring System
| Criteria | Score | Score Bar |
|---|---|---|
| Dividend Yield | 3 | |
| Dividend Stability | 4 | |
| Dividend Growth | 2 | |
| Payout Ratio | 1 | |
| Financial Stability | 2 | |
| Dividend Continuity | 4 | |
| Cashflow Coverage | 2 | |
| Balance Sheet Quality | 3 |
Total Score: 21/40
Rating
Despite its historically strong dividend track record, IFF currently faces significant challenges in maintaining dividend growth and stable payout ratios. Investors may consider exercising caution, taking into account the current financial volatility and strategic initiatives for profitability improvement. Overall, IFF presents a mixed dividend profile warranting careful consideration for yield-focused investors.
Smart Data Insight
Master the Perfect Entry & Exit for this Stock
Don't leave your profits to chance. Historically, this stock follows specific seasonal patterns that institutional traders use to maximize returns.
- ✅ Identify the "Golden Buying Window"
- ✅ Avoid high-risk correction cycles
- ✅ Backtested data from the last 20+ years