NCLH: Fundamental Ratio Analysis - Norwegian Cruise Line Holdings Ltd

NCLH: Evaluation of key financial ratios, analyst ratings, and price targets. A data-driven perspective on the valuation and market expectations.
April 16, 2026 a 06:00 pm
KLAC: Analysts Ratings - KLA Corporation

KLAC: Comprehensive breakdown of current and historical analyst ratings, offering insights into how expert sentiment has evolved over time.
April 16, 2026 a 05:01 pm
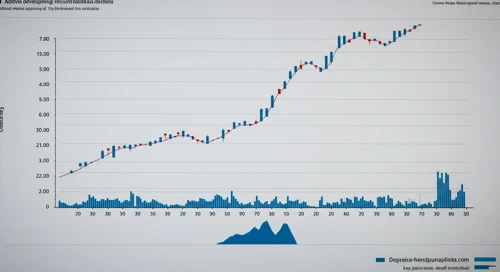
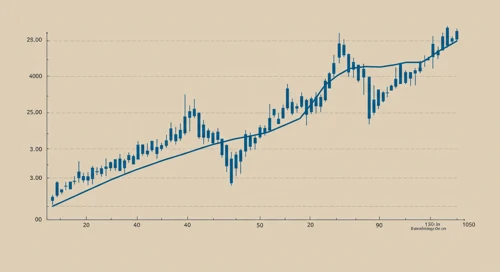
EBAY: Fibunacci Level Technical Analysis - eBay Inc
EBAY: Fibonacci retracement levels to identify key potential support and resistance zones, based on recent price trends.
April 16, 2026 a 04:44 pm
BKNG: Analysts Ratings - Booking Holdings Inc

BKNG: Comprehensive breakdown of current and historical analyst ratings, offering insights into how expert sentiment has evolved over time.
April 16, 2026 a 04:38 pm
ABBV: Fundamental Ratio Analysis - AbbVie Inc
ABBV: Evaluation of key financial ratios, analyst ratings, and price targets. A data-driven perspective on the valuation and market expectations.
April 16, 2026 a 03:43 pm
MU: Dividend Analysis - Micron Technology Inc

MU: In-depth analysis of a company's dividend stability and key fundamental ratios to assess its financial strength and long-term investment potential.
April 16, 2026 a 03:31 pm
IBKR: Fibunacci Level Technical Analysis - Interactive Brokers Group Inc
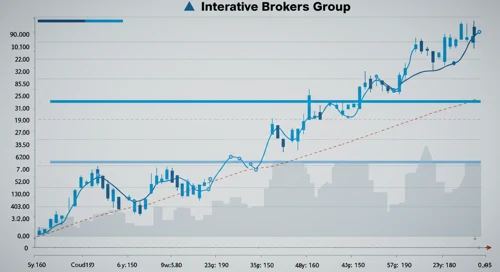
IBKR: Fibonacci retracement levels to identify key potential support and resistance zones, based on recent price trends.
April 16, 2026 a 03:15 pm
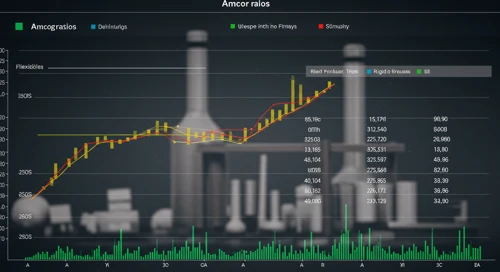
AMCR: Analysts Ratings - Amcor plc
April 16, 2026 a 09:00 pm
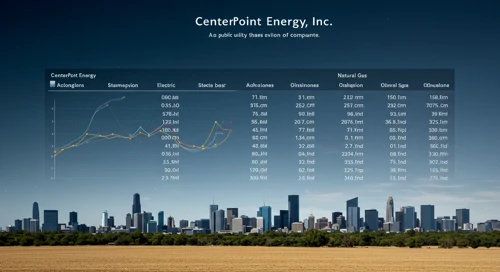
CNP: Analysts Ratings - CenterPoint Energy Inc
April 16, 2026 a 08:38 pm
EVRG: Fundamental Ratio Analysis - Evergy Inc
April 16, 2026 a 07:43 pm
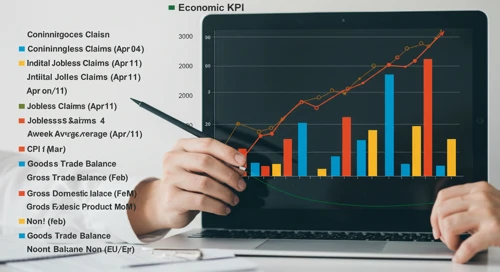
Todays Important Key Figures 16 Apr
April 16, 2026 a 07:00 pm
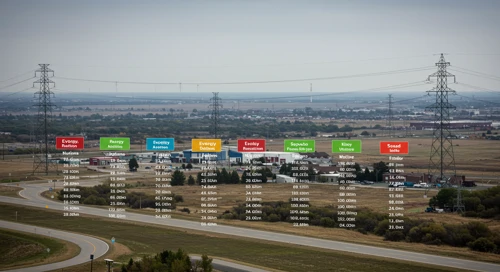
Financials Comparison. 16 Apr

Comparison of Financials. Where is strength and weakness? What has developed well and badly?
April 16, 2026 a 03:12 pm
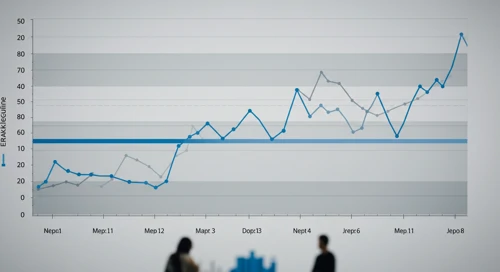
TPR: Trend with Support and Resistance Levels - Tapestry Inc
TPR: Current price trend is evaluated alongside key support and resistance level. View of potential turning points and price momentum.
April 16, 2026 a 02:03 pm
VTR: Fundamental Ratio Analysis - Ventas Inc

VTR: Evaluation of key financial ratios, analyst ratings, and price targets. A data-driven perspective on the valuation and market expectations.
April 16, 2026 a 01:00 pm
CSCO: Analysts Ratings - Cisco Systems Inc

CSCO: Comprehensive breakdown of current and historical analyst ratings, offering insights into how expert sentiment has evolved over time.
April 16, 2026 a 01:00 pm
VRSN: Dividend Analysis - VeriSign Inc

VRSN: In-depth analysis of a company's dividend stability and key fundamental ratios to assess its financial strength and long-term investment potential.
April 16, 2026 a 12:46 pm
LUV: Analysts Ratings - Southwest Airlines Co
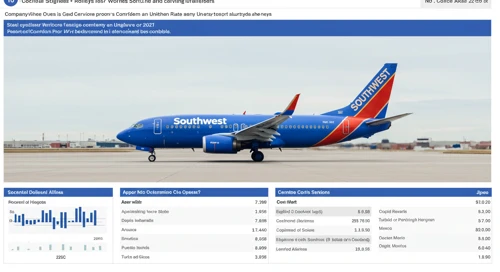
LUV: Comprehensive breakdown of current and historical analyst ratings, offering insights into how expert sentiment has evolved over time.
April 16, 2026 a 12:38 pm
Bonds Comparison. 16 Apr

Comparison of Bonds. Where is strength and weakness? What has developed well and badly?
April 16, 2026 a 12:32 pm
Stock Market - Heatmap
Use mouse wheel to zoom in and out. Click a ticker to display detailed information in a new window. Hover mouse cursor over a ticker to see more data.
Stock's
PHM: Trend with Support and Resistance Levels - PulteGroup Inc
PHM: Current price trend is evaluated alongside key support and resistance level. View of potential turning points and price momentum.
April 16, 2026 a 09:03 am
RL: Analysts Ratings - Ralph Lauren Corporation

RL: Comprehensive breakdown of current and historical analyst ratings, offering insights into how expert sentiment has evolved over time.
April 16, 2026 a 09:00 am
LRCX: Analysts Ratings - Lam Research Corporation
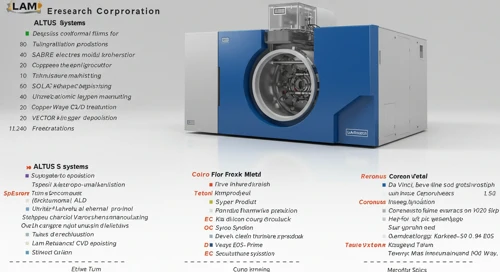
LRCX: Comprehensive breakdown of current and historical analyst ratings, offering insights into how expert sentiment has evolved over time.
April 16, 2026 a 08:38 am
HST: Fundamental Ratio Analysis - Host Hotels and Resorts Inc
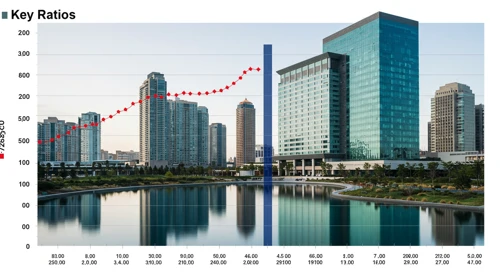
HST: Evaluation of key financial ratios, analyst ratings, and price targets. A data-driven perspective on the valuation and market expectations.
April 16, 2026 a 08:00 am
O: Dividend Analysis - Realty Income Corporation
O: In-depth analysis of a company's dividend stability and key fundamental ratios to assess its financial strength and long-term investment potential.
April 16, 2026 a 07:46 am
WSM: Fundamental Ratio Analysis - Williams Sonoma Inc

WSM: Evaluation of key financial ratios, analyst ratings, and price targets. A data-driven perspective on the valuation and market expectations.
April 16, 2026 a 07:43 am
LYB: Dividend Analysis - LyondellBasell Industries NV
LYB: In-depth analysis of a company's dividend stability and key fundamental ratios to assess its financial strength and long-term investment potential.
April 16, 2026 a 07:31 am
MO: Fibunacci Level Technical Analysis - Altria Group Inc
April 16, 2026 a 11:44 am

CSGP: Fundamental Ratio Analysis - CoStar Group Inc
April 16, 2026 a 11:43 am

MAR: Dividend Analysis - Marriott International Inc
April 16, 2026 a 11:31 am
ICE: Fibunacci Level Technical Analysis - Intercontinental Exchange Inc
April 16, 2026 a 10:15 am
LII: Fibunacci Level Technical Analysis - Lennox International Inc
LII: Fibonacci retracement levels to identify key potential support and resistance zones, based on recent price trends.
April 16, 2026 a 06:44 am
PKG: Fibunacci Level Technical Analysis - Packaging Corporation of America
PKG: Fibonacci retracement levels to identify key potential support and resistance zones, based on recent price trends.
April 16, 2026 a 05:15 am
PFG: Trend with Support and Resistance Levels - Principal Financial Group Inc
PFG: Current price trend is evaluated alongside key support and resistance level. View of potential turning points and price momentum.
April 16, 2026 a 04:03 am
MDT: Dividend Analysis - Medtronic plc

MDT: In-depth analysis of a company's dividend stability and key fundamental ratios to assess its financial strength and long-term investment potential.
April 16, 2026 a 03:31 am
ES: Trend with Support and Resistance Levels - Eversource Energy
ES: Current price trend is evaluated alongside key support and resistance level. View of potential turning points and price momentum.
April 16, 2026 a 03:15 am
GIS: Dividend Analysis - General Mills Inc

GIS: In-depth analysis of a company's dividend stability and key fundamental ratios to assess its financial strength and long-term investment potential.
April 16, 2026 a 02:46 am
TKO: Analysts Ratings - TKO Group Holdings Inc

TKO: Comprehensive breakdown of current and historical analyst ratings, offering insights into how expert sentiment has evolved over time.
April 15, 2026 a 09:00 pm
Economic Calendar
Currencies
AUDNZD: Trend with Support and Resistance Levels

AUDNZD: Current price trend is evaluated alongside key support and resistance level. View of potential turning points and price momentum.
April 15, 2026 a 04:28 am
Todays Important Key Figures 14 Apr
Today’s important economic data releases – a snapshot of key indicators influencing markets and shaping financial expectations.
April 14, 2026 a 07:00 pm
GBPSEK: Fibunacci Level Technical Analysis

GBPSEK: Fibonacci retracement levels to identify key potential support and resistance zones, based on recent price trends.
April 14, 2026 a 05:08 am
GBPNZD: Trend with Support and Resistance Levels
GBPNZD: Current price trend is evaluated alongside key support and resistance level. View of potential turning points and price momentum.
April 14, 2026 a 04:28 am
Important Key Figures of the last Days
Overview of key economic indicators released over the past days, highlighting their potential impact on markets and investor sentiment.
April 14, 2026 a 02:31 am
Todays Important Key Figures 13 Apr

Today’s important economic data releases – a snapshot of key indicators influencing markets and shaping financial expectations.
April 13, 2026 a 07:00 pm
AUDCAD: Fibunacci Level Technical Analysis
AUDCAD: Fibonacci retracement levels to identify key potential support and resistance zones, based on recent price trends.
April 13, 2026 a 05:08 am
CHFJPY: Fibunacci Level Technical Analysis
April 16, 2026 a 05:08 am
Important Key Figures of the last Days
April 16, 2026 a 02:31 am
Todays Important Key Figures 15 Apr
April 15, 2026 a 07:00 pm

EURNZD: Fibunacci Level Technical Analysis
April 15, 2026 a 05:08 am
GBPJPY: Trend with Support and Resistance Levels
GBPJPY: Current price trend is evaluated alongside key support and resistance level. View of potential turning points and price momentum.
April 13, 2026 a 04:28 am
GBPAUD: Fibunacci Level Technical Analysis
GBPAUD: Fibonacci retracement levels to identify key potential support and resistance zones, based on recent price trends.
April 12, 2026 a 05:08 am
USDCHF: Trend with Support and Resistance Levels
USDCHF: Current price trend is evaluated alongside key support and resistance level. View of potential turning points and price momentum.
April 12, 2026 a 04:28 am
AUDUSD: Fibunacci Level Technical Analysis
AUDUSD: Fibonacci retracement levels to identify key potential support and resistance zones, based on recent price trends.
April 11, 2026 a 05:08 am
EURUSD: Trend with Support and Resistance Levels
EURUSD: Current price trend is evaluated alongside key support and resistance level. View of potential turning points and price momentum.
April 11, 2026 a 04:28 am
Todays Important Key Figures 11 Apr
Today’s important economic data releases – a snapshot of key indicators influencing markets and shaping financial expectations.
April 10, 2026 a 11:00 pm
Todays Important Key Figures 10 Apr
Today’s important economic data releases – a snapshot of key indicators influencing markets and shaping financial expectations.
April 10, 2026 a 07:00 pm
Currencies