April 16, 2026 a 03:31 pm

MU: Dividend Analysis - Micron Technology, Inc.
Micron Technology, Inc. presents an interesting case for dividend-focused investors. With a modest dividend yield and a long history of dividend history maintenance, it shows signs of financial stability. However, certain metrics suggest that careful monitoring is warranted, particularly given its low payout ratios and mixed historical financial performance.
📊 Overview
Providing insights into the company's sectoral alignment and dividend-related performance indicators.
| Key Aspects | Values |
|---|---|
| Sector | Technology |
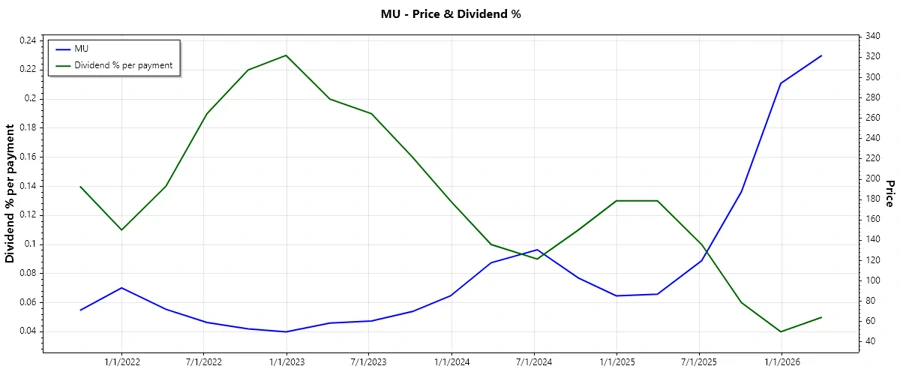
| Dividend yield | 0.15% |
| Current dividend per share | 0.47 USD |
| Dividend history | 12 years |
| Last cut or suspension | None |
🔍 Dividend History
Understanding past dividend payouts helps assess the company's commitment to returning value to shareholders and can signify stability in earnings.
| Year | Dividend per Share (USD) |
|---|---|
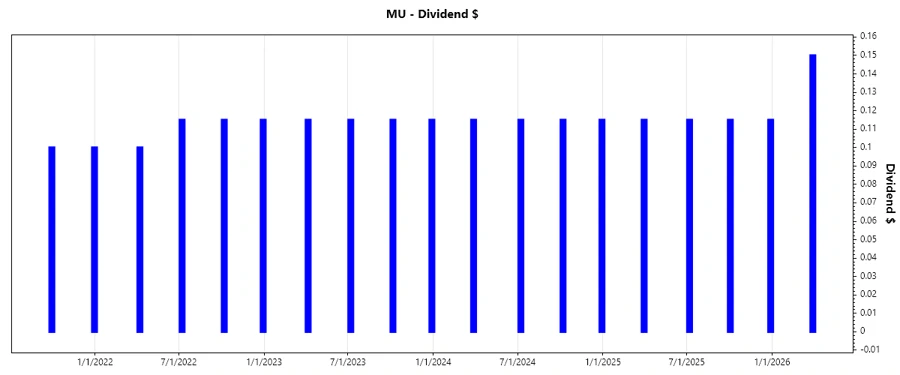
| 2026 | 0.15 |
| 2025 | 0.460 |
| 2024 | 0.460 |
| 2023 | 0.460 |
| 2022 | 0.445 |
📈 Dividend Growth
Assessing growth over time highlights the company's ability to increase dividends, reflecting potential prosperity and efficient capital management.
| Time | Growth |
|---|---|
| 3 years | 1.11% |
| 5 years | 79.05% |
The average dividend growth is 79.05% over 5 years. This shows moderate but steady dividend growth.
🧮 Payout Ratio
Payout ratios provide insight into the company’s capacity to cover dividend payments through earnings and cash flows, which is crucial for assessing sustainability.
| Key figure ratio | Percentage |
|---|---|
| EPS-based | 2.18% |
| Free cash flow-based | 5.13% |
Despite showing prudence, the very low EPS and FCF-based payout ratios might limit dividend payouts' future enhancement unless earnings grow significantly.
💶 Cashflow & Capital Efficiency
Evaluation of cash flow metrics reveals operational efficiency, liquidity strength, and capital reinvestment abilities, important for sustaining dividends.
| Metric | 2025 | 2024 | 2023 |
|---|---|---|---|
| Free Cash Flow Yield | 1.23% | 0.11% | -8.00% |
| Earnings Yield | 6.27% | 0.74% | -7.63% |
| CAPEX/Ope.Cash Flow | 90.48% | 98.58% | 492.37% |
| Stock Comp/Revenue | 2.60% | 3.32% | 3.84% |
| FCF/Op.Cash Flow Ratio | 9.52% | 1.42% | -392.37% |
Cash flow stability appears variable with some challenges, yet they maintain strategic capital allocation to support further dividend enhancements.
🔗 Balance Sheet & Leverage Analysis
Assessing leverage and liquidity ratios gives insights into financial health and debt structure, key for evaluating future dividend sustainability.
| Metric | 2025 | 2024 | 2023 |
|---|---|---|---|
| Debt-to-Equity | 0.282 | 0.310 | 0.316 |
| Debt-to-Assets | 0.185 | 0.202 | 0.217 |
| Net Debt/EBITDA | 30.48% | 77.88% | 242.24% |
| Current Ratio | 1.52 | 1.79 | 2.70 |
| Quick Ratio | 1.79 | 1.68 | 2.70 |
With lower leverage ratios, the company portrays strong financial health and liquidity, contributing to its ability to sustain and potentially increase dividends.
🚀 Fundamental Strength & Profitability
Profitability metrics and capital deployment efficiency are crucial indicators for ensuring dividend payouts and potential growth.
| Metric | 2025 | 2024 | 2023 |
|---|---|---|---|
| ROE | 15.76% | 1.72% | -13.22% |
| ROA | 10.31% | 1.12% | -9.08% |
| Net Margin | 22.85% | 3.10% | -37.54% |
| EBIT Margin | 27.13% | 4.96% | -35.13% |
The company's mixed levels of profitability and efficiency call for strategic improvements, but its relatively solid margins indicate potential for sustaining current dividend levels.
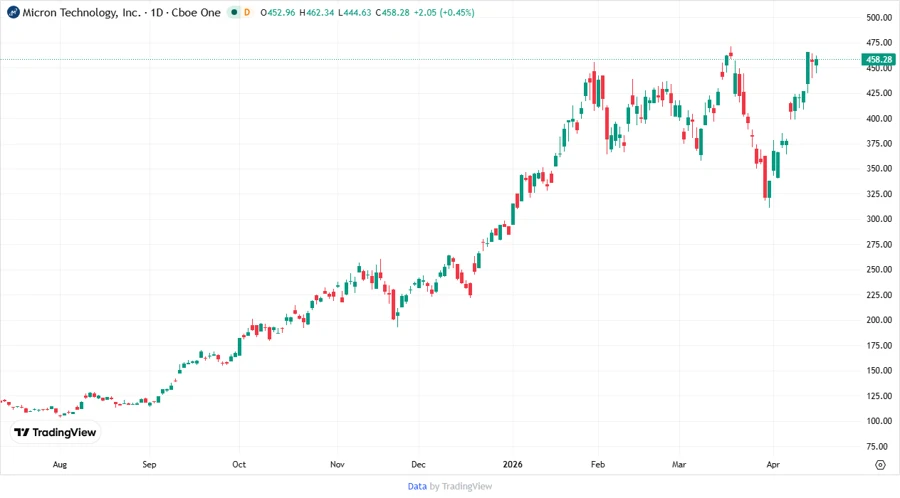
📈 Price Development
⭐ Dividend Scoring System
An individualized scoring system assessing multiple dimensions of dividend sustainability and growth.
| Category | Score | Graph |
|---|---|---|
| Dividend yield | 2 | |
| Dividend Stability | 4 | |
| Dividend growth | 3 | |
| Payout ratio | 5 | |
| Financial stability | 4 | |
| Dividend continuity | 4 | |
| Cashflow Coverage | 3 | |
| Balance Sheet Quality | 4 |
Overall Score: 29/40
🗣️ Rating
Micron Technology, Inc. displays a strong capability to maintain its dividend, supported by financial stability and a commendable payout strategy. Its balance sheet strength and moderately growing dividends suggest a cautious buy for income-focused investors looking for reliable, albeit modest, returns.
Smart Data Insight
Master the Perfect Entry & Exit for this Stock
Don't leave your profits to chance. Historically, this stock follows specific seasonal patterns that institutional traders use to maximize returns.
- ✅ Identify the "Golden Buying Window"
- ✅ Avoid high-risk correction cycles
- ✅ Backtested data from the last 20+ years