April 16, 2026 a 07:31 am
LYB: Dividend Analysis - LyondellBasell Industries N.V.
LyondellBasell Industries N.V. exhibits a robust dividend yield, reflecting strong income potential for investors. Its long-standing dividend history and recent performance underline its reliability, albeit recent financial challenges might pose risks. Strategic attention to cash flow management and capital efficiency remains crucial for sustained dividend delivery.
Overview 📊
LyondellBasell operates in the Basic Materials sector, presenting a compelling dividend yield of 8.29%. With a consistent dividend history of 16 years, and the last known suspension or cut being absent, it showcases resilience and dependability in shareholder returns.
| Aspect | Details |
|---|---|
| Sector | Basic Materials |
| Dividend Yield | 8.29% |
| Current Dividend per Share | 5.48 USD |
| Dividend History | 16 years |
| Last Cut or Suspension | None |
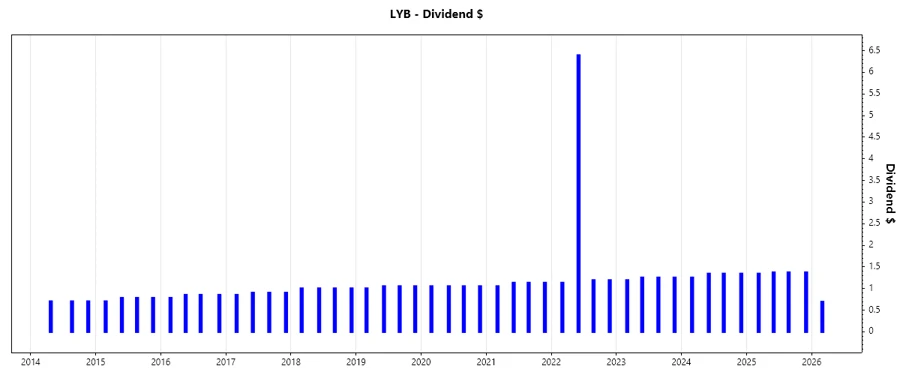
Dividend History 📜
An in-depth look at LyondellBasell’s dividend history reveals its commitment to consistent payouts, even in volatile market conditions. This history reflects positively on shareholder trust and long-term financial strategy.
| Year | Dividend per Share |
|---|---|
| 2026 | 0.69 |
| 2025 | 5.45 |
| 2024 | 5.27 |
| 2023 | 4.94 |
| 2022 | 9.90 |
Dividend Growth 📈
Evaluating the dividend growth helps assess the company’s ability to enhance shareholder value over time. Over the past 5 years, growth has been moderate yet stable, supporting the company's strategic focus on sustainability.
| Time | Growth |
|---|---|
| 3 years | -0.18% |
| 5 years | 5.35% |
The average dividend growth is 5.35% over 5 years. This shows moderate but steady dividend growth.
Payout Ratio 💸
The payout ratios provide insights into the portion of earnings and free cash flow allocated to dividend payments. Current ratios indicate a need for strategic re-evaluation, especially with EPS ratio indicating unsustainability, contrasted by a more balanced FCF ratio.
| Key Figure | Ratio |
|---|---|
| EPS-based | -237.42% |
| Free cash flow-based | 78.03% |
Negative EPS payout suggests financial stress, though FCF coverage remains comparatively healthy.
Cashflow & Capital Efficiency 💰
Cash flow analysis is crucial for understanding liquidity and financial health. LyondellBasell’s figures demand a proactive approach towards optimizing free cash, earnings yield, and capital expenditures.
| Metric | 2023 | 2024 | 2025 |
|---|---|---|---|
| Free Cash Flow Yield | 11.04% | 8.20% | 2.75% |
| Earnings Yield | 6.84% | 5.63% | -5.33% |
| CAPEX to Operating CF | 30.98% | 48.15% | 83.02% |
| Stock-based Compensation to Revenue | 0% | 0.23% | 0.30% |
| Free Cash Flow / Operating Cash Flow | 69.02% | 51.85% | 16.98% |
| Return on Invested Capital | 7.94% | 5.15% | -1.13% |
Overall, caution in balancing CAPEX with cash yields will enhance capital efficiency and profitability.
Balance Sheet & Leverage Analysis 📊
Leverage metrics provide insights into liquidity and overall financial health. LyondellBasell’s structure suggests tailored strategies to mitigate high leverage and optimize asset utilization.
| Metric | 2023 | 2024 | 2025 |
|---|---|---|---|
| Debt-to-Equity | 1.01 | 1.04 | 1.58 |
| Debt-to-Assets | 35.14% | 36.15% | 46.94% |
| Debt-to-Capital | 50.13% | 50.91% | 61.29% |
| Net Debt to EBITDA | 2.07 | 2.65 | 10.56 |
| Current Ratio | 1.84 | 1.83 | 1.77 |
| Quick Ratio | 1.17 | 1.13 | 1.19 |
| Financial Leverage | 2.86 | 2.87 | 3.37 |
Efforts to decrease leverage and improve liquidity metrics will be vital to strengthen financial footing.
Fundamental Strength & Profitability 📈
Examining profitability and R&D investments delivers insights into strategic market positioning. LyondellBasell’s figures indicate challenges but underscore potential for innovation-driven efficiency.
| Metric | 2023 | 2024 | 2025 |
|---|---|---|---|
| Return on Equity | 16.35% | 10.91% | -7.37% |
| Return on Assets | 5.71% | 3.80% | -2.19% |
| Net Margin | 5.14% | 3.37% | -2.46% |
| EBIT Margin | 7.55% | 5.17% | -0.68% |
| EBITDA Margin | 11.28% | 8.95% | 3.93% |
| Gross Margin | 12.79% | 11.32% | 9.00% |
| R&D to Revenue | 0.32% | 0.33% | 0.46% |
Efforts towards optimizing profitability margins and enhancing R&D investments remain fundamental for future growth.
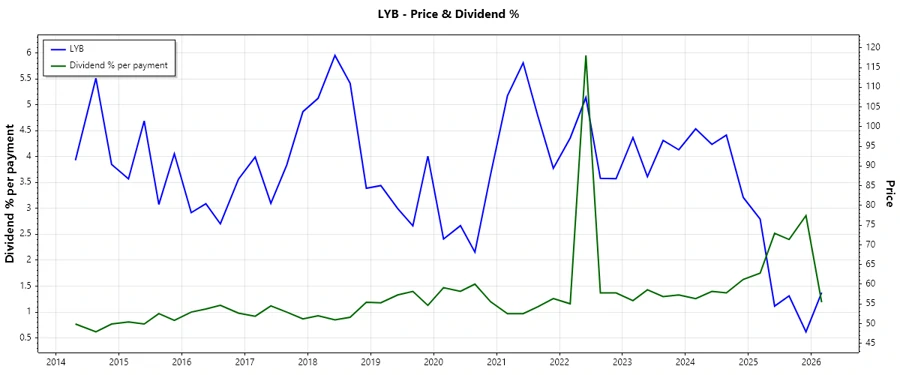
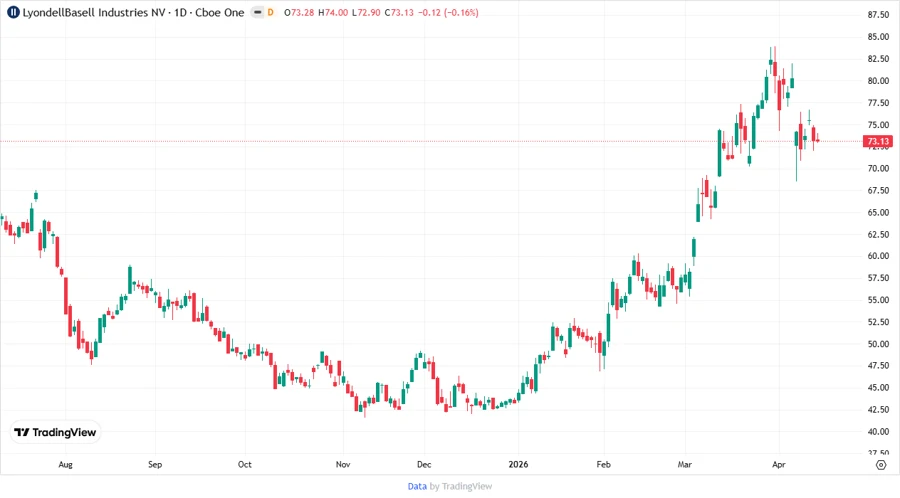
Price Development 📉
Dividend Scoring System 📊
| Criteria | Score | Bar |
|---|---|---|
| Dividend Yield | 4 | |
| Dividend Stability | 3 | |
| Dividend Growth | 3 | |
| Payout Ratio | 2 | |
| Financial Stability | 2 | |
| Dividend Continuity | 4 | |
| Cashflow Coverage | 3 | |
| Balance Sheet Quality | 2 |
Overall Score: 23/40
Rating & Recommendation ✅
LyondellBasell Industries N.V. retains a strong dividend yield appealing to income-focused investors. However, potential investors should cautiously consider recent financial metrics and leverage concerns before opting for long-term investment strategies. The company's commitment to sustaining and growing dividends is commendable but requires ongoing strategic adjustments to navigate financial volatilities.
Smart Data Insight
Master the Perfect Entry & Exit for this Stock
Don't leave your profits to chance. Historically, this stock follows specific seasonal patterns that institutional traders use to maximize returns.
- ✅ Identify the "Golden Buying Window"
- ✅ Avoid high-risk correction cycles
- ✅ Backtested data from the last 20+ years