April 12, 2026 a 05:08 am
GBPAUD: Fibonacci Analysis
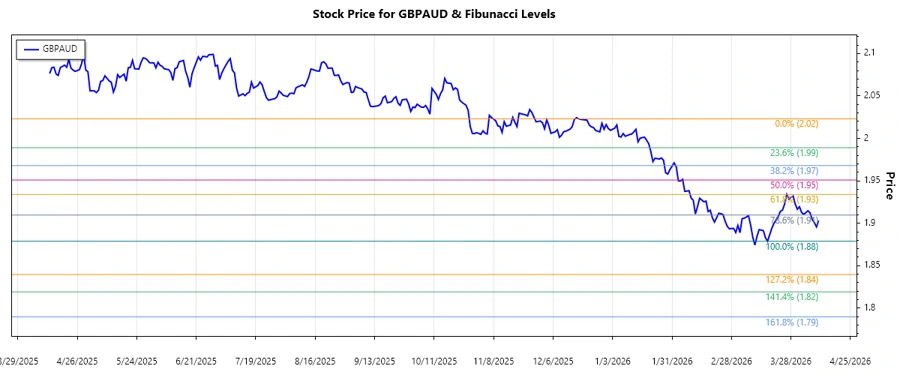
The GBPAUD pair has exhibited a pronounced downtrend over the last few months. This trend has been characterized by declining peaks and troughs, significantly affecting trading strategies. Investors and analysts are keenly observing this pair to identify potential reversal points or continuation patterns.
Fibonacci Analysis
By analyzing the GBPAUD trend data, a dominant downtrend is evident from January to April 2026. The highest point observed was at 2.02309 on 2025-12-18, and the lowest point recorded was 1.87883 on 2026-03-17. The Fibonacci retracement levels were calculated to provide price levels of potential support or resistance.
| Parameter | Details |
|---|---|
| Start Date | 2025-12-18 |
| End Date | 2026-03-17 |
| High Price | 2.02309 (2025-12-18) |
| Low Price | 1.87883 (2026-03-17) |
| Fibonacci Level | Price |
| 0.236 | 1.91204 |
| 0.382 | 1.94374 |
| 0.5 | 1.95096 |
| 0.618 | 1.95818 |
| 0.786 | 1.98438 |
| Current Evaluation | Details |
| Current Price | 1.90314 |
| Retracement Zone | 0.236 |
| Interpretation | The current price is in the 0.236 retracement zone, potentially indicating limited bounce-back. |
Conclusion
The GBPAUD currency pair has been in a significant decline, with the current price trading within the 0.236 Fibonacci retracement level. This level often suggests a minor rebound before possibly continuing the downtrend. Analysts are advised to look for confirmations of support at these levels. A break below could lead to further declines, while a reversal might offer new opportunities. It's crucial to keep an eye on future economic indicators that can affect the pair's movement and to reassess strategies regularly.