April 16, 2026 a 04:44 pm
EBAY: Fibonacci Analysis - eBay Inc.
eBay Inc. has consistently shown resilience in the online marketplace industry. Its diverse operations spanning various platforms allow for robust adaptability in fluctuating market scenarios. The recent data analysis indicates a strengthening in its stock price, which attracts both growth-oriented and value investors. This assessment aids in understanding potential investment opportunities and risk management strategies.
Fibonacci Analysis
| Parameter | Details |
|---|---|
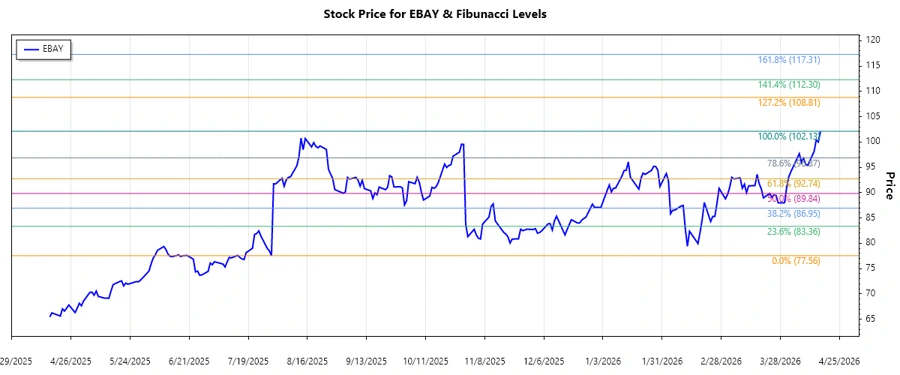
| Trend Start Date | 2025-07-30 |
| Trend End Date | 2026-04-16 |
| High Price (Date) | $102.13 (2026-04-16) |
| Low Price (Date) | $77.56 (2025-07-30) |
| Fibonacci Level | Price Level |
|---|---|
| 0.236 | $86.44 |
| 0.382 | $89.70 |
| 0.5 | $91.84 |
| 0.618 | $93.99 |
| 0.786 | $97.72 |
The current price is within the 0.786 retracement zone, indicating potential support near $97.72. This suggests a possible continuation of the upward trend if this level holds.
From a technical standpoint, the retracement level at 0.786 serves as a strong support level. If the price can sustain above this, it could indicate a bullish momentum continuation.
Conclusion
The analysis of eBay Inc.'s stock suggests that the company's stock is currently experiencing a robust upward trend. The stock has been resilient, brushing off minor market fluctuations, with current support at the 0.786 Fibonacci retracement level. This provides an attractive entry for risk-tolerant investors. However, market participants should remain vigilant for any signs of a trend reversal if the support does not hold. The potential for near-term upside remains strong, particularly in the context of eBay's innovative approaches and expansion in the e-commerce sector.