
April 11, 2026 a 05:08 am
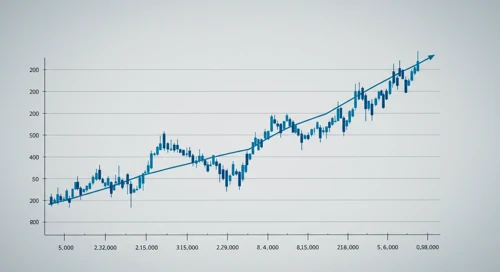

AUDUSD: Fibonacci Analysis
The AUDUSD has been exhibiting significant fluctuations, impacted by global economic factors and central bank decisions. Recently, the pair has shown signs of stability as traders respond to market cues. Understanding its technical position is crucial for investors making strategic decisions.
Fibonacci Analysis
Analyzing the AUDUSD data, we observe a dominant uptrend, starting from late December 2025 and reaching a high in mid-March 2026. Using these points, the Fibonacci retracement levels provide critical insights into potential support and resistance zones.
| Detail | Value |
|---|---|
| Start Date | 2025-12-21 |
| End Date | 2026-03-11 |
| High Price | 0.71509 (2026-03-11) |
| Low Price | 0.64537 (2025-11-21) |
| 0.236 Retracement | 0.66044 |
| 0.382 Retracement | 0.67498 |
| 0.5 Retracement | 0.68023 |
| 0.618 Retracement | 0.69163 |
| 0.786 Retracement | 0.70201 |
The current price of 0.70549 places the AUDUSD in between the 0.786 retracement, suggesting it could be experiencing a strong resistance zone.
Technical analysis indicates potential resistance at the 0.786 level, and a possible reversal might occur unless a breakthrough is achieved.
Conclusion
In conclusion, the AUDUSD currently shows potential resistance at critical Fibonacci levels. This can provide opportunities for traders looking to short the pair, should it fail to break through the resistance. However, a successful breach could suggest a continued upward momentum, indicating a bullish outlook. Investors should stay vigilant of macroeconomic indicators and policy changes that could sway the currency's direction.
Smart Data Insight
Master the Perfect Entry & Exit for this Stock
Don't leave your profits to chance. Historically, this stock follows specific seasonal patterns that institutional traders use to maximize returns.
- ✅ Identify the "Golden Buying Window"
- ✅ Avoid high-risk correction cycles
- ✅ Backtested data from the last 20+ years