April 16, 2026 a 11:31 am

MAR: Dividend Analysis - Marriott International, Inc.
Marriott International, Inc. offers a modest dividend yield complemented by consistent dividend payouts reflecting its stable growth. With a diversified revenue model and a history of dividends without suspensions, Marriott upholds a strong reputation in the hospitality sector. Its financial strategies are well-aligned with stakeholder interests, despite some leverage and market challenges.
📊 Overview
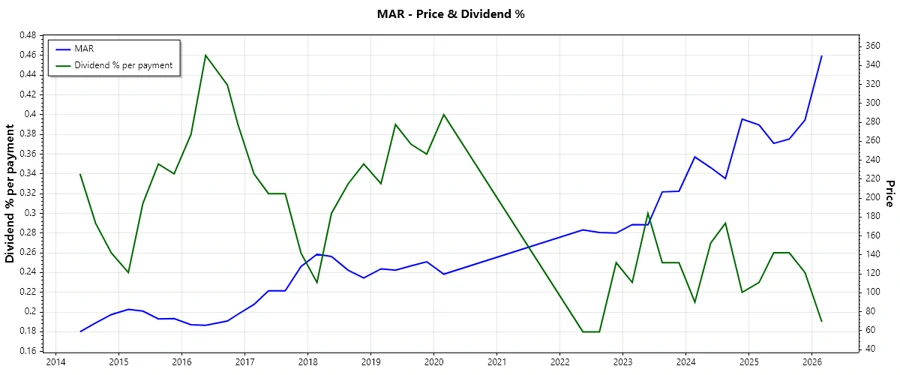
Marriott International operates within the Hospitality sector, sustaining a current dividend yield of 0.76%. The company's dividend story extends across 28 years, demonstrating stability with its last management adjustment unmentioned, signifying reliability.
| Metric | Value |
|---|---|
| Sector | Hospitality |
| Dividend yield | 0.76% |
| Current dividend per share | 2.67 USD |
| Dividend history | 28 years |
| Last cut or suspension | None |
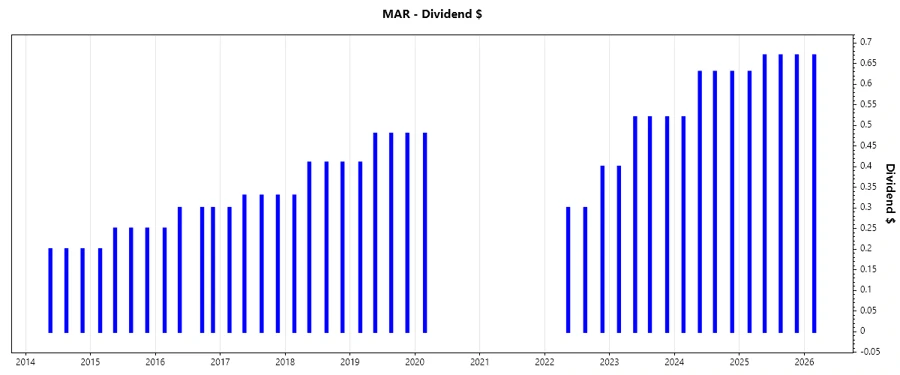
📈 Dividend History
The historical trajectory of Marriott's dividends highlights its financial robustness, offering critical insights into shareholder returns over time. The continuity and growth are pivotal for assessing investment worthiness.
| Year | Dividend per Share |
|---|---|
| 2026 | 0.67 |
| 2025 | 2.64 |
| 2024 | 2.41 |
| 2023 | 1.96 |
| 2022 | 1.00 |
🔍 Dividend Growth
Analyzing growth reveals Marriott's consistent dividend acceleration, crucial for gauging future payout potential. It reflects capital discipline and efficient reinvestment strategies.
| Time | Growth |
|---|---|
| 3 Years | 0.38% |
| 5 Years | 0.41% |
The average dividend growth is 0.41% over 5 years. This shows moderate but steady dividend growth.
🗣️ Payout Ratio
Payout ratio reflects profitability and sustainability of dividends. A balanced ratio indicates prudent management of retained earnings, furthering growth potential while rewarding shareholders.
| Key figure ratio | Percentage |
|---|---|
| EPS-based | 27.60% |
| Free cash flow-based | 24.45% |
The EPS payout ratio of 27.60% and FCF payout ratio of 24.45% suggest Marriott retains sufficient earnings to fuel future growth, while maintaining a reliable dividend payout strategy.
💼 Cashflow & Capital Efficiency
Cash flow analysis reflects operational efficiency and financial agility. A sound cash profile supports dividend sustainability, expansion opportunities, and risk mitigation under fluctuating market conditions.
| Metric | 2025 | 2024 | 2023 |
|---|---|---|---|
| Free Cash Flow Yield | 3.13% | 2.52% | 3.99% |
| Earnings Yield | 3.12% | 3.00% | 4.53% |
| CAPEX to Operating Cash Flow | 18.80% | 27.28% | 14.26% |
| Stock-based Compensation to Revenue | 0.90% | 0.94% | 0.86% |
| Free Cash Flow / Operating Cash Flow Ratio | 81.20% | 72.71% | 85.74% |
Marriott's cash flow and capital efficiencies enhance its growth prospects and provide a cushion against market volatility, enabling sustainable shareholder value creation.
🔍 Balance Sheet & Leverage Analysis
Balance sheet strength is pivotal to financial stability and managerial flexibility against cyclical downturns. Marriott’s leverage ratios provide insights into debt strategy and liquidity management.
| Metric | 2025 | 2024 | 2023 |
|---|---|---|---|
| Debt-to-Equity | -4.53 | -5.09 | -18.71 |
| Debt-to-Assets | 62.03% | 58.21% | 49.70% |
| Debt-to-Capital | 128.33% | 124.43% | 105.65% |
| Net Debt to EBITDA | 3.73 | 3.42 | 2.84 |
| Current Ratio | 0.43 | 0.40 | 0.43 |
| Quick Ratio | 0.43 | 0.40 | 0.43 |
| Financial Leverage | -7.30 | -8.75 | -37.65 |
Marriott’s financial ratios highlight weaknesses in its leveraged position, yet liquidity tracking and capital utilization portray a stable short-term outlook.
📈 Fundamental Strength & Profitability
Evaluating profitability margins assesses Marriott's operational competence and return potential on capital and assets, providing granular insights into maximized shareholder value.
| Metric | 2025 | 2024 | 2023 |
|---|---|---|---|
| Return on Equity | -68.97% | -79.38% | -452.05% |
| Return on Assets | 9.44% | 9.07% | 12.01% |
| Margins: Net | 9.93% | 9.46% | 13.00% |
| Margins: EBIT | 16.00% | 15.32% | 16.63% |
| Margins: EBITDA | 17.14% | 17.28% | 18.47% |
| Margins: Gross | 21.34% | 20.32% | 21.60% |
| Research & Development to Revenue | 0% | 0% | 0% |
Marriott's profitability indicators suggest resilient operations, showcasing its capacity to drive shareholder returns amid persistently competitive market environments.
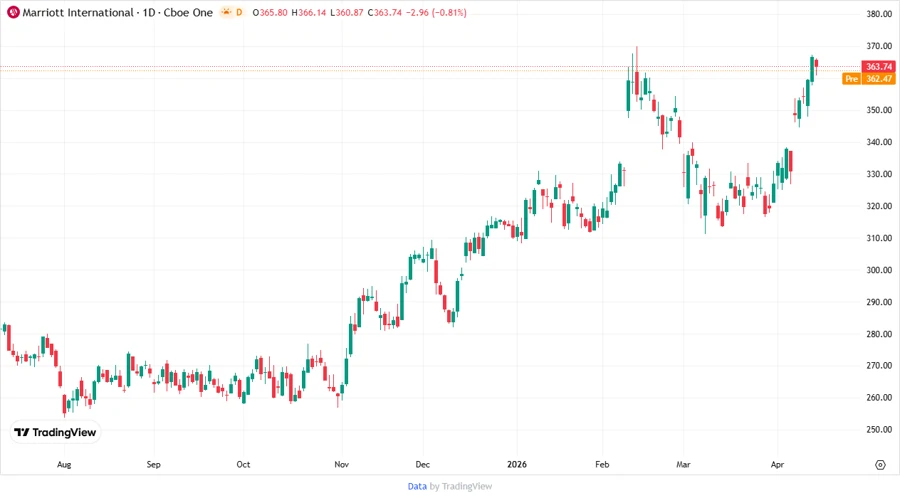
🏗️ Price Development
✅ Dividend Scoring System
| Category | Score | Score Bar |
|---|---|---|
| Dividend yield | 2 | |
| Dividend Stability | 4 | |
| Dividend Growth | 3 | |
| Payout Ratio | 4 | |
| Financial Stability | 3 | |
| Dividend Continuity | 5 | |
| Cashflow Coverage | 4 | |
| Balance Sheet Quality | 3 |
Total Score: 28/40
📝 Rating
Marriott International, Inc.'s current dividend profile is stable with a moderate growth outlook. While the company ensures consistent payouts, potential investors need to weigh its leveraged balance sheet against its operational strengths. Overall, Marriott continues to be a viable option for dividend-seeking investors but should be approached with due diligence considering market conditions and financial strategies.