April 16, 2026 a 03:31 am

MDT: Dividend Analysis - Medtronic plc
Medtronic plc demonstrates a robust financial profile with an impressive 45-year history of uninterrupted dividend payments, offering investors a mix of stability and moderate growth potential. With its significant market capitalization and a current dividend yield of over 3%, Medtronic appeals to both income-focused and value-conscious investors. However, its high payout ratio may limit future dividend growth if earnings do not accelerate.
📊 Overview
Medtronic operates within the healthcare sector, which is known for its resilience and steady cash flows, key for sustaining its 3.26% dividend yield. The company's commitment to dividends is showcased by its 45-year track record without any recent cuts or suspensions.
| Category | Details |
|---|---|
| Sector | Healthcare |
| Dividend yield | 3.26% |
| Current dividend per share | $2.79 |
| Dividend history | 45 years |
| Last cut or suspension | None |
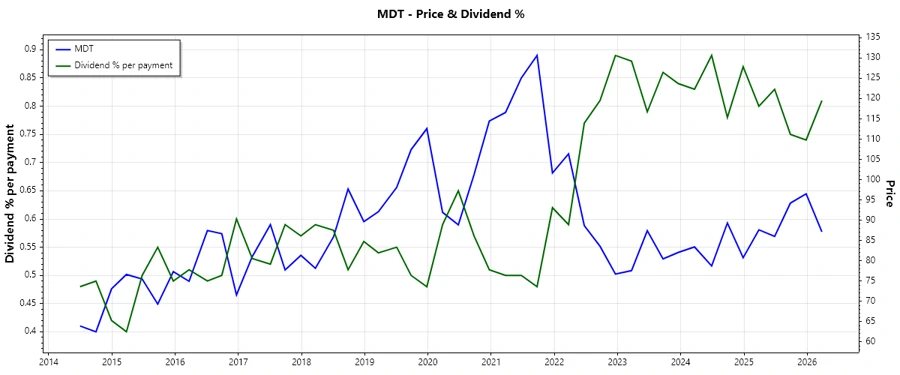
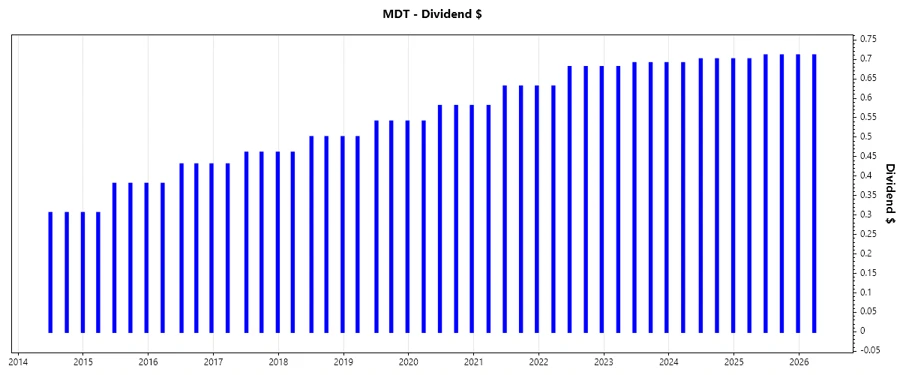
🗣️ Dividend History
Knowing the history of dividends aids in understanding a company's stability in income distribution. Medtronic's reliable payments assure investors of its income-generating capacity. An examination of recent payments confirms this trend.
| Year | Dividend Per Share (USD) |
|---|---|
| 2026 | 0.71 |
| 2025 | 2.83 |
| 2024 | 2.79 |
| 2023 | 2.75 |
| 2022 | 2.67 |
📈 Dividend Growth
The growth rate of dividends can indicate an organization's progression in financial health and strategy. Medtronic's growth rates over three and five years reveal a steady upward trajectory, essential for long-term investors concerned with inflation-beating income.
| Time | Growth |
|---|---|
| 3 years | 1.96% |
| 5 years | 4.42% |
The average dividend growth is 4.42% over 5 years. This shows moderate but steady dividend growth.
📉 Payout Ratio
A company's payout ratio is critical for assessing dividend sustainability. Medtronic's EPS-based ratio stands at 77.57%, indicating most of its earnings are distributed as dividends, leaving limited room for significant dividend increases without earnings growth.
| Key figure | Ratio |
|---|---|
| EPS-based | 77.57% |
| Free cash flow-based | 66.25% |
With an EPS payout ratio of 77.57% and a free cash flow ratio of 66.25%, Medtronic's dividend is sustainable but allows little room for financial distress or downturns in revenue.
✅ Cashflow & Capital Efficiency
The efficiency of capital usage and cash flow stability is pivotal for Medtronic's capacity to maintain and grow dividends. A positive free cash flow yield and prudent CAPEX management ensure long-term investor returns.
| Year | 2023 | 2024 | 2025 |
|---|---|---|---|
| Free Cash Flow Yield | 3.79% | 4.91% | 4.79% |
| Earnings Yield | 3.11% | 3.47% | 4.31% |
| CAPEX to Operating Cash Flow | 24.16% | 23.38% | 26.39% |
| Stock-based Compensation to Revenue | 1.14% | 1.21% | 1.28% |
| Free Cash Flow / Operating Cash Flow Ratio | 75.84% | 76.62% | 73.61% |
Measured cash flow stability and capital efficiency are evident in Medtronic's investments and operating methods, promoting sustainable long-term return.
⚠️ Balance Sheet & Leverage Analysis
Medtronic's debt metrics provide insight into its capacity to meet financial obligations and leverage for growth. The current and quick ratios emphasize strong liquidity, preventing reliance on external funding at high costs.
| Year | 2023 | 2024 | 2025 |
|---|---|---|---|
| Debt-to-Equity | 0.47 | 0.50 | 0.59 |
| Debt-to-Assets | 0.27 | 0.28 | 0.31 |
| Debt-to-Capital | 0.32 | 0.33 | 0.37 |
| Net Debt to EBITDA | 2.62 | 2.89 | 2.85 |
| Current Ratio | 2.39 | 2.03 | 1.85 |
| Quick Ratio | 1.81 | 1.55 | 1.42 |
| Financial Leverage | 1.77 | 1.79 | 1.91 |
Though its leverage ratios are on the higher side, Medtronic's proactive debt management and liquidity help maintain a balanced power to operate efficiently and generate returns.
✅ Fundamental Strength & Profitability
High profitability ratios reflect Medtronic's efficiency in generating returns on investment, crucial for maintaining future dividend capacity and enhancing shareholder value.
| Year | 2023 | 2024 | 2025 |
|---|---|---|---|
| Return on Equity | 7.30% | 7.32% | 9.71% |
| Return on Assets | 4.13% | 4.09% | 5.08% |
| Margins: Net | 12.03% | 11.36% | 13.90% |
| Margins: EBIT | 19.21% | 17.17% | 18.96% |
| Margins: EBITDA | 27.85% | 25.35% | 27.49% |
| Margins: Gross | 65.67% | 65.34% | 65.32% |
| Research & Development to Revenue | 8.63% | 8.45% | 8.14% |
Medtronic's profitability metrics indicate strong operational efficacy and the potential to maintain substantial investor returns, further evidenced by robust research and development investments ensuring future growth.
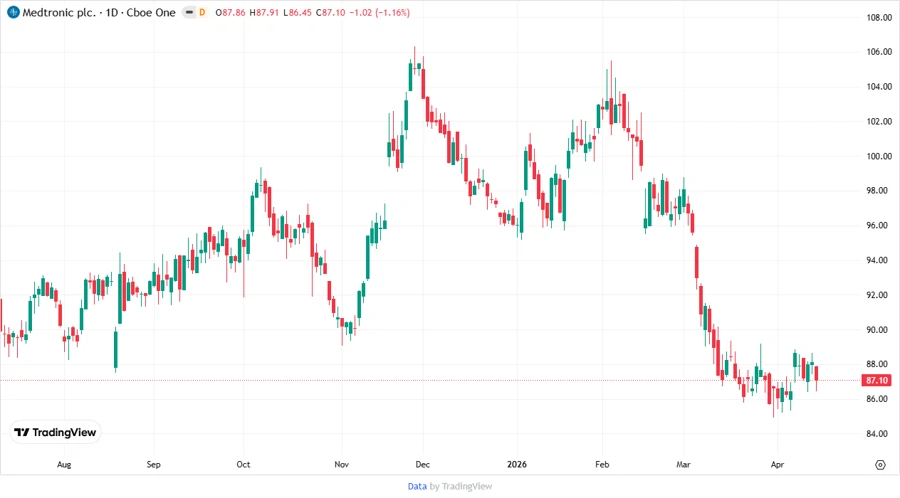
📈 Price Development
Dividend Scoring System
Evaluating Medtronic's dividend profile through scoring highlights strengths and areas needing improvement, aiding in investment decision-making.
| Category | Score | Score Bar |
|---|---|---|
| Dividend yield | 4 | |
| Dividend Stability | 5 | |
| Dividend growth | 3 | |
| Payout ratio | 3 | |
| Financial stability | 4 | |
| Dividend continuity | 5 | |
| Cashflow Coverage | 4 | |
| Balance Sheet Quality | 4 |
Total Score: 32/40
Rating
Medtronic plc stands out as a resilient, dependable dividend payer with strong foundational virtues, suitable for conservative investors seeking income stability with moderate growth potential amidst a challenging economic landscape.
Smart Data Insight
Master the Perfect Entry & Exit for this Stock
Don't leave your profits to chance. Historically, this stock follows specific seasonal patterns that institutional traders use to maximize returns.
- ✅ Identify the "Golden Buying Window"
- ✅ Avoid high-risk correction cycles
- ✅ Backtested data from the last 20+ years