
April 16, 2026 a 03:12 pm


Financial Stocks - Performance Analysis
The financial sector has exhibited intriguing performance patterns across varying time frames. The last week saw a mix of resilience and volatility, while one-month and three-month performances revealed broader market trends. This analysis delves into the nuances of stock movements within these periods, shedding light on top performers, laggards, and overarching sector trends.
📊 Financial Stocks Performance One Week
| Stock | Performance (%) | Performance |
|---|---|---|
| AXP | 3.56% | |
| MA | 3.24% | |
| BAC | 3.04% | |
| VISA | 2.48% | |
| SPGI | 1.56% | |
| PGR | 0.79% | |
| GS | -0.42% | |
| JPM | -1.41% | |
| BRK.B | -2.30% | |
| WFC | -6.70% |
In the past week, American Express (AXP) has outperformed others with a notable rise, while Wells Fargo (WFC) trailed with a significant drop. Such contrasting performances depict the fluctuating investor sentiment concerning financial stocks.
📈 Financial Stocks Performance One Month
| Stock | Performance (%) | Performance |
|---|---|---|
| BAC | 14.10% | |
| GS | 11.23% | |
| AXP | 9.40% | |
| JPM | 6.66% | |
| WFC | 5.63% | |
| MA | 2.86% | |
| VISA | 2.58% | |
| SPGI | -0.21% | |
| PGR | -1.02% | |
| BRK.B | -3.76% |
Over the past month, Bank of America (BAC) emerged as the frontrunner with impressive gains, underscoring a positive market sentiment. BRK.B, however, continued to show weakness amidst this period of growth for others.
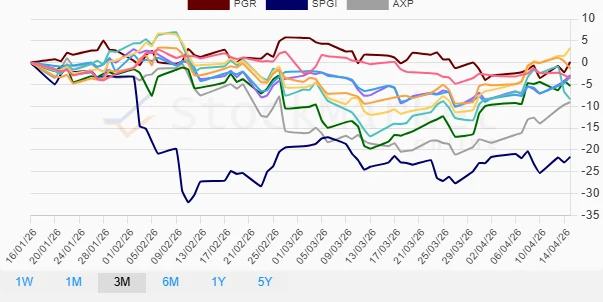
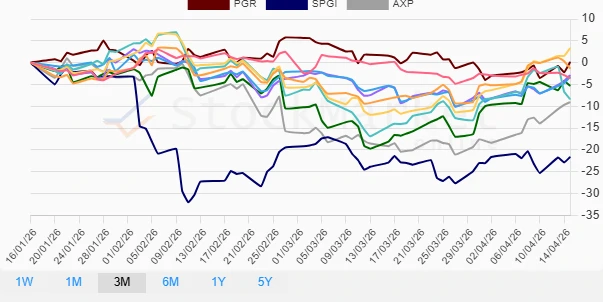
📉 Financial Stocks Performance Three Months
| Stock | Performance (%) | Performance |
|---|---|---|
| PGR | 0.13% | |
| BAC | 3.34% | |
| JPM | -1.34% | |
| MA | -2.86% | |
| VISA | -3.26% | |
| BRK.B | -3.60% | |
| GS | -5.32% | |
| AXP | -9.04% | |
| WFC | -8.38% | |
| SPGI | -21.61% |
Over the quarter, S&P Global (SPGI) faced substantial challenges, marking the highest decline. Despite this, Bank of America (BAC) showed reasonable resilience amidst broader sectoral declines.
💡 Summary
In summary, the financial sector witnessed a rollercoaster ride over the three periods analyzed. Strong performances from Bank of America (BAC) over the monthly period contrast starkly with S&P Global's (SPGI) noticeable three-month decline. Investors should cautiously consider these trends, as they reflect both potential opportunities and risks within an evolving market landscape.
Smart Data Insight
Master the Perfect Entry & Exit for this Stock
Don't leave your profits to chance. Historically, this stock follows specific seasonal patterns that institutional traders use to maximize returns.
- ✅ Identify the "Golden Buying Window"
- ✅ Avoid high-risk correction cycles
- ✅ Backtested data from the last 20+ years