April 16, 2026 a 04:03 am
PFG: Trend and Support & Resistance Analysis - Principal Financial Group, Inc.
Principal Financial Group, Inc. has shown significant resilience and variability in its stock performance over the analyzed period. The current data analysis demonstrates both opportunities and challenges, reflecting market conditions and company strategic decisions affecting its stock price. Careful assessment of trend indicators and support/resistance levels can offer investors insightful entry or exit points.
Trend Analysis
| Date | Closing Price | Trend |
|---|---|---|
| 2026-04-15 | 94.68 | ▲ |
| 2026-04-14 | 94.14 | ▼ |
| 2026-04-13 | 93.55 | ▼ |
| 2026-04-10 | 91.80 | ▼ |
| 2026-04-09 | 92.32 | ▲ |
| 2026-04-08 | 94.20 | ▲ |
| 2026-04-07 | 91.06 | ▼ |
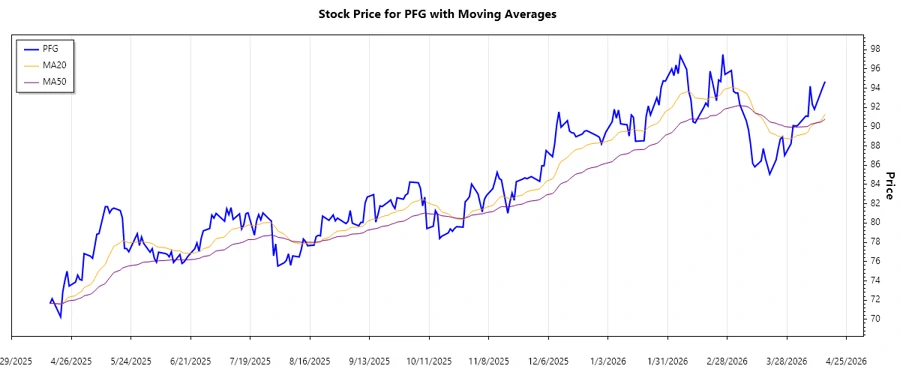
The calculated EMA20 is currently greater than EMA50, indicating a prevailing ▲ upward trend. This suggests that the stock has experienced a positive momentum, potentially providing bullish signals for investors.
Support and Resistance
| Level Type | Zone |
|---|---|
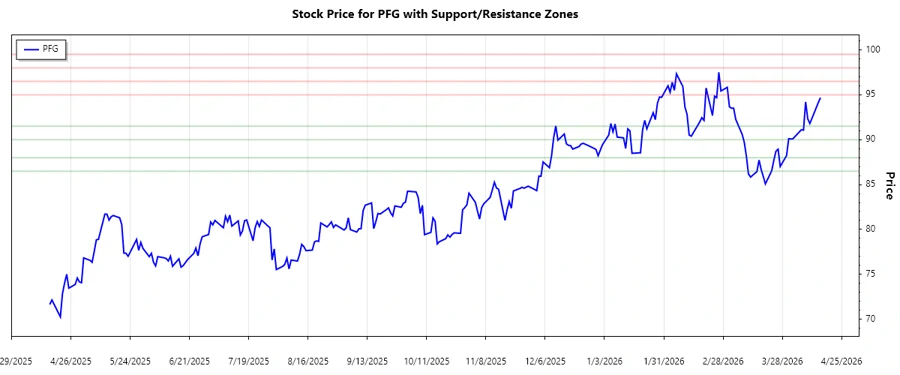
| Support | 86.50 - 88.00 |
| Support | 90.00 - 91.50 |
| Resistance | 95.00 - 96.50 |
| Resistance | 98.00 - 99.50 |
The current closing price remains within a defined support zone of 90.00 - 91.50, providing a potentially strong base level for future upward movement. The stock's proximity to resistance levels needs careful monitoring for any potential breakout signal.
Conclusion
The Principal Financial Group, Inc. stock showcases an encouraging ▲ upward trend, indicative of recent bullish momentum. This is complemented by identifiable support and resistance levels, which can serve as crucial indicators for traders when deciding entry and exit points. However, vigilance is required as market dynamics could alter these trends. Investors should weigh the stock's potential for gains against market volatility. The stock's position within the support zones suggests imminent upward potential, but resistance levels could pose challenges. Overall, strategic patience and timely analysis remain pivotal.