April 16, 2026 a 02:46 am

GIS: Dividend Analysis - General Mills, Inc.
General Mills, Inc., a renowned player in the consumer foods sector, presents a strong dividend profile with a noteworthy dividend yield exceeding 6%. The company's commitment to maintaining a consistent dividend history across 44 years exemplifies its robust dividend policy. As the market continues to evolve, investors should carefully consider GIS's payout ratios and cash flow effectiveness to assess future dividend sustainability.
Overview 📊
General Mills operates within the Consumer Staples sector and offers a dividend yield of 6.86%. This is underpinned by a current dividend per share of $2.41, exhibiting a long-standing history with no cuts in 44 years.
| Metric | Value |
|---|---|
| Sector | Consumer Staples |
| Dividend yield | 6.86 % |
| Current dividend per share | 2.41 USD |
| Dividend history | 44 years |
| Last cut or suspension | None |
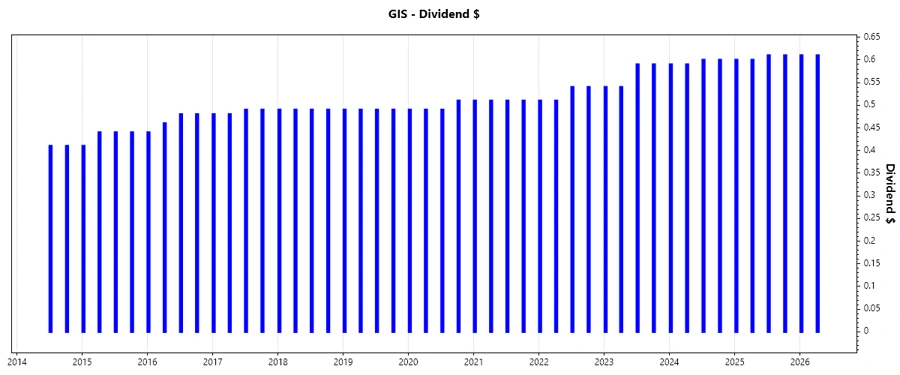
Dividend History 🗣️
A consistent dividend policy for 44 years without suspension demonstrates GIS's reliability in returning value to shareholders. The stability in dividend payouts is a crucial consideration for income-focused investors.
| Year | Dividend per Share (USD) |
|---|---|
| 2026 | 1.22 |
| 2025 | 2.42 |
| 2024 | 2.38 |
| 2023 | 2.26 |
| 2022 | 2.10 |
Dividend Growth 📈
Examining the dividend growth provides insight into how GIS has been enhancing shareholder value over time. A 3-year growth of approximately 4.84% and 5-year growth of 4.10% illustrate a steady increase in shareholder returns.
| Time | Growth |
|---|---|
| 3 years | 4.84 % |
| 5 years | 4.10 % |
The average dividend growth is 4.10% over 5 years. This shows moderate but steady dividend growth, enhancing the company's appeal to long-term investors.
Payout Ratio ⚠️
The payout ratios indicate how much of the company's earnings and free cash flow are being returned to shareholders as dividends. An EPS-based payout ratio of 59.02% and a free cash flow-based payout ratio of 78.08% suggest a significant portion of income is distributed, yet leaving room for reinvestment and financial maneuverability.
| Key figure | Ratio |
|---|---|
| EPS-based | 59.02 % |
| Free cash flow-based | 78.08 % |
Both EPS and FCF payout ratios are within manageable levels, indicating the company's ability to sustain its dividend policy without jeopardizing financial stability.
Cashflow & Capital Efficiency ✅
Analyzing cash flow and capital efficiency ratios helps in understanding how well GIS is utilizing its resources to generate cash flows. The company's Free Cash Flow Yield and Earnings Yield provide insights into its cash-generating efficiency relative to its asset and equity base.
| Year | 2023 | 2024 | 2025 |
|---|---|---|---|
| Free Cash Flow Yield | 4.17% | 6.43% | 7.75% |
| Earnings Yield | 5.18% | 6.35% | 7.75% |
| CAPEX to Operating Cash Flow | 24.81% | 23.44% | 21.43% |
| Stock-based Compensation to Revenue | 0.56% | 0.48% | 0.47% |
| Free Cash Flow / Operating Cash Flow Ratio | 75.19% | 76.56% | 78.57% |
The increasing Free Cash Flow Yield alongside an adequate Free Cash Flow ratio compared to Operating Cash Flow indicates sound cash management and operational efficiency.
Balance Sheet & Leverage Analysis 🧮
Balance Sheet metrics such as Debt-to-Equity and Net Debt to EBITDA ratios are critical in assessing GIS's leverage and financial stability. These ratios reveal the degree to which the company relies on debt to finance its assets.
| Year | 2023 | 2024 | 2025 |
|---|---|---|---|
| Debt-to-Equity | 1.15 | 1.42 | 1.66 |
| Debt-to-Assets | 38.36% | 42.31% | 46.25% |
| Debt-to-Capital | 53.59% | 58.63% | 62.45% |
| Net Debt to EBITDA | 2.81 | 3.16 | 3.81 |
| Current Ratio | 0.69 | 0.65 | 0.67 |
| Quick Ratio | 0.40 | 0.38 | 0.43 |
| Financial Leverage | 3.01 | 3.35 | 3.59 |
The consistent levels of leverage ratios suggest GIS operates with a prudent approach to debt, balancing risk and capital efficiency.
Fundamental Strength & Profitability 💪
Profitability metrics and return ratios illustrate GIS's effectiveness in generating profits and returns on investments. A steady growth in gross margins and return on equity underscores the company’s core financial strength.
| Year | 2023 | 2024 | 2025 |
|---|---|---|---|
| Return on Equity | 24.82% | 26.57% | 24.95% |
| Return on Assets | 8.25% | 7.93% | 6.94% |
| Margins: Net | 12.91% | 12.57% | 11.78% |
| EBIT | 17.60% | 17.76% | 17.36% |
| EBITDA | 20.32% | 20.54% | 20.13% |
| Gross | 32.58% | 34.91% | 34.55% |
| Research & Development to Revenue | 0.00% | 0.00% | 0.00% |
The steady profitability ratios reflect solid operational efficiency and effective cost management strategies, reinforcing GIS's competitive position in the market.
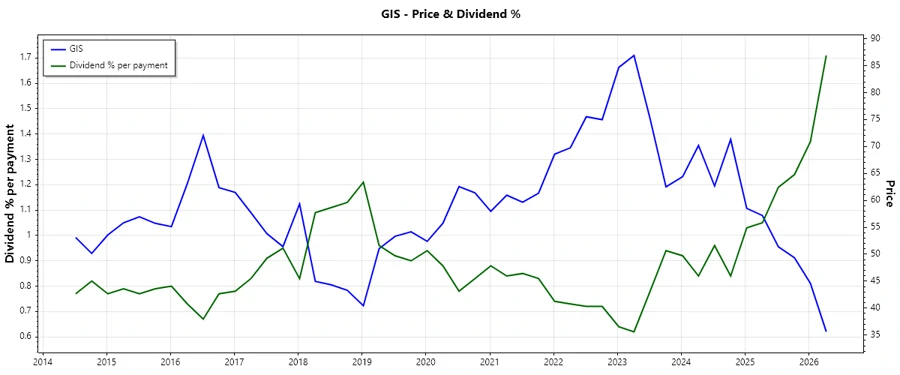
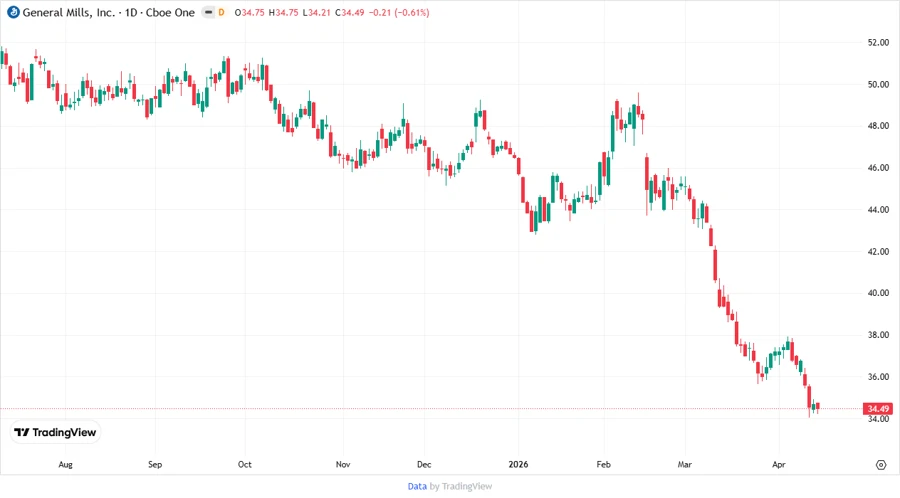
Price Development 📉
Dividend Scoring System 🏆
Evaluating GIS's dividend profile through a comprehensive scoring system offers a clearer picture of its overall performance and sustainability.
| Category | Score | Value |
|---|---|---|
| Dividend yield | 5 | |
| Dividend Stability | 5 | |
| Dividend growth | 3 | |
| Payout ratio | 4 | |
| Financial stability | 4 | |
| Dividend continuity | 5 | |
| Cashflow Coverage | 4 | |
| Balance Sheet Quality | 4 |
Total Score: 34/40
Rating 🏅
Overall, General Mills, Inc. presents a strong dividend profile, offering stable and reliable returns to its shareholders. The combination of a high dividend yield, consistent growth, and prudent financial management makes GIS a compelling choice for dividend-focused investors seeking a balance of income and growth potential within the Consumer Staples sector.