April 16, 2026 a 11:44 am
MO: Fibonacci Analysis - Altria Group, Inc.
Altria Group, Inc., with its robust portfolio of tobacco brands like Marlboro, shows fluctuating market trends. The recent price movements suggest careful market positioning is critical. Investors must consider both market opportunities and regulatory challenges impacting tobacco product sales.
Fibonacci Analysis
| Analysis Item | Details |
|---|---|
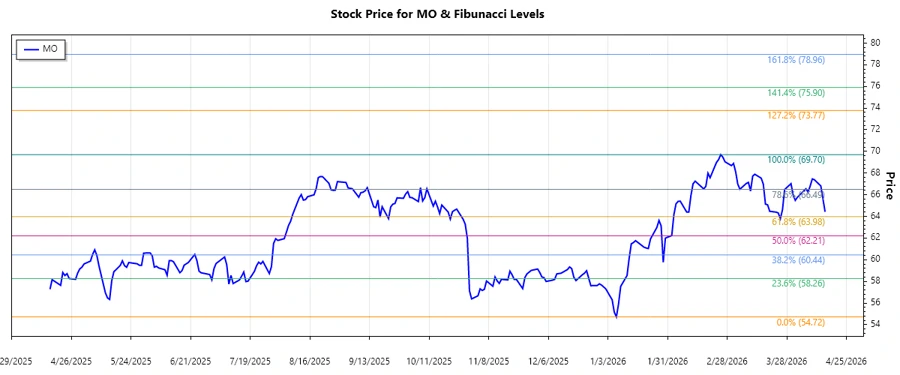
| Trend Start Date | 2025-08-18 |
| Trend End Date | 2026-04-15 |
| High Point Price (Date) | $69.7 (2026-02-25) |
| Low Point Price (Date) | $54.72 (2026-01-07) |
| Fibonacci Retracement Levels |
|
| Current Retracement Zone | 0.5 |
| Technical Interpretation | The current price suggests potential support around the 0.5 retracement level, indicating a consolidation phase. |
Conclusion
Altria Group's stock has demonstrated volatility with a defined upward trend from 2025 to 2026. Currently, it navigates a critical Fibonacci retracement zone, suggesting potential market stabilization or support. Analysts should watch for firm support levels at the 0.5 Fibonacci level, which might indicate continuation or reversal. The regulatory environment and changing consumer preferences remain pivotal. Opportunities lie in strategic market maneuvers and diversification into reduced-risk products. Risks include possible regulatory setbacks and shifts in consumer behavior.