April 16, 2026 a 12:46 pm

VRSN: Dividend Analysis - VeriSign, Inc.
🔍 VeriSign, Inc., with its moderate dividend yield and recent dividend history, presents a unique case for dividend investors. While it offers consistent payouts, its growth in dividends is negative, signaling potential concerns. Investors need to weigh its low payout ratios against its history of dividend adjustments before making investment decisions.
📊 Overview
The intricate dynamics of VeriSign's sector, Information Technology, directly impact its dividend strategies. A yield of 1.44% is accompanied by a current dividend per share of 2.33 USD, bolstered by a 4-year dividend history. Interestingly, there has been no record of dividend cuts or suspensions recently.
| Metric | Details |
|---|---|
| Sector | Information Technology |
| Dividend yield | 1.44% |
| Current dividend per share | 2.33 USD |
| Dividend history | 4 years |
| Last cut or suspension | None |
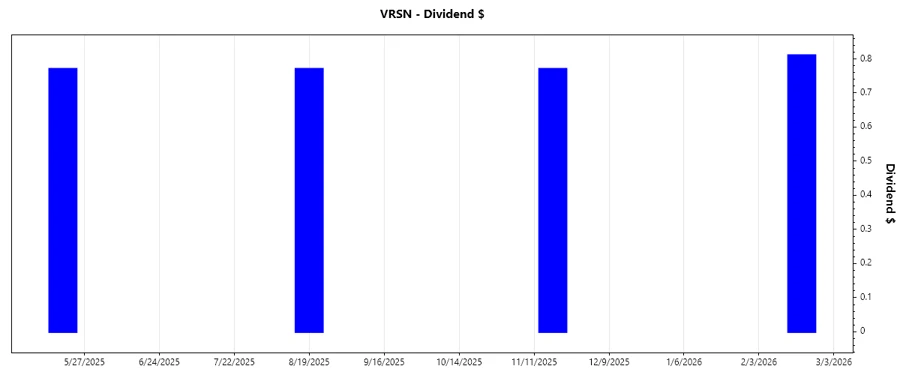
🔙 Dividend History
Analyzing dividend history is crucial as it reflects a company's commitment to returning value to shareholders. With a recent history of varying dividend payments, insights into the sustainability and reliability of these payouts are essential.
| Year | Dividend per Share |
|---|---|
| 2026 | 0.81 USD |
| 2025 | 2.31 USD |
| 2011 | 2.75 USD |
| 2010 | 3.00 USD |
📈 Dividend Growth
VeriSign's dividend growth is a vital performance indicator, particularly in volatile market environments. It has encountered negative growth, with a 3-year rate of -5.65% and a 5-year rate of -3.43%. This analysis encapsulates how the company's growth potential affects its dividend strategies.
| Time | Growth |
|---|---|
| 3 years | -5.65% |
| 5 years | -3.43% |
The average dividend growth over the past 5 years is -3.43%, indicating a gradual decline, which may concern potential dividend investors.
🏦 Payout Ratio
Payout ratios, both EPS-based at 26.07% and FCF-based at 19.99%, provide insights into sustainability. These ratios suggest a conservative approach to dividends, ensuring the company retains sufficient earnings for reinvestment and growth.
| Key figure ratio | |
|---|---|
| EPS-based | 26.07% |
| Free cash flow-based | 19.99% |
These figures indicate a low risk of unsustainable dividend payments, granting VeriSign the ability to manage potential downturns efficiently.
🔍 Cashflow & Capital Efficiency
The analysis of cash flows and capital efficiency identifies operational sustainability. With a Free Cash Flow Yield of 4.23% and an Earnings Yield of 3.25%, coupled with efficient CAPEX management, VeriSign shows strong operational and capital allocation strategies.
| Year | 2023 | 2024 | 2025 |
|---|---|---|---|
| Free Cash Flow Yield | 4.23% | 4.31% | 4.76% |
| Earnings Yield | 3.25% | 3.87% | 3.68% |
| CAPEX to Operating Cash Flow | 2.09% | 3.11% | 2.09% |
| Stock-based Compensation to Revenue | 0.012% | 0.039% | 0.042% |
| Free Cash Flow / Operating Cash Flow Ratio | 97.91% | 96.89% | 97.91% |
The stability of cash flows supports capital efficiency, indicating a stable growth trajectory for long-term investors.
⚖️ Balance Sheet & Leverage Analysis
Understanding balance sheets and leverage offers core analysis into financial stability. Debt-to-equity and liquidity ratios suggest management's adept handling of financial obligations, despite unconventional figures indicating operational complexities.
| Year | 2023 | 2024 | 2025 |
|---|---|---|---|
| Debt-to-Equity | -1.14 | -0.92 | -0.83 |
| Debt-to-Assets | 1.03 | 1.28 | 1.36 |
| Debt-to-Capital | 8.30 | -11.52 | -5.05 |
| Net Debt to EBITDA | 1.42 | 1.40 | 1.27 |
| Current Ratio | 0.83 | 0.43 | 0.49 |
| Quick Ratio | 0.83 | 0.43 | 0.49 |
| Financial Leverage | -1.11 | -0.72 | -0.62 |
Though financial figures exhibit unusual data, they suggest a calculated approach to debt management, enhancing long-term solvency predictions.
🧮 Fundamental Strength & Profitability
Fundamental metrics elucidate VeriSign's market potential and profitability. With high operating margins and strategic research investments, the company cultivates long-term profitability.
| Year | 2023 | 2024 | 2025 |
|---|---|---|---|
| Return on Equity | -51.71% | -40.13% | -38.33% |
| Return on Assets | 0.47% | 0.56% | 0.62% |
| Margins: Net | 54.76% | 50.45% | 49.84% |
| Margins: EBIT | 70.44% | 70.45% | 68.83% |
| Margins: EBITDA | 73.40% | 72.82% | 70.71% |
| Margins: Gross | 86.79% | 87.71% | 88.15% |
| Research & Development to Revenue | 6.09% | 6.21% | 6.25% |
The impressive margins and investment in R&D emphasize the company's commitment to sustaining robust profitability trends.
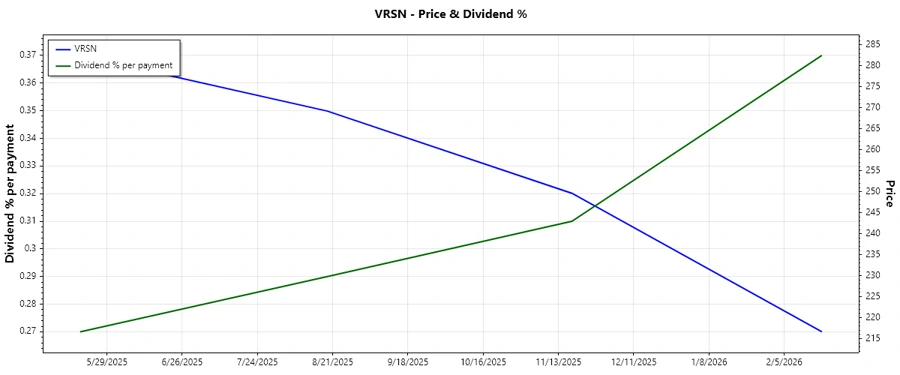
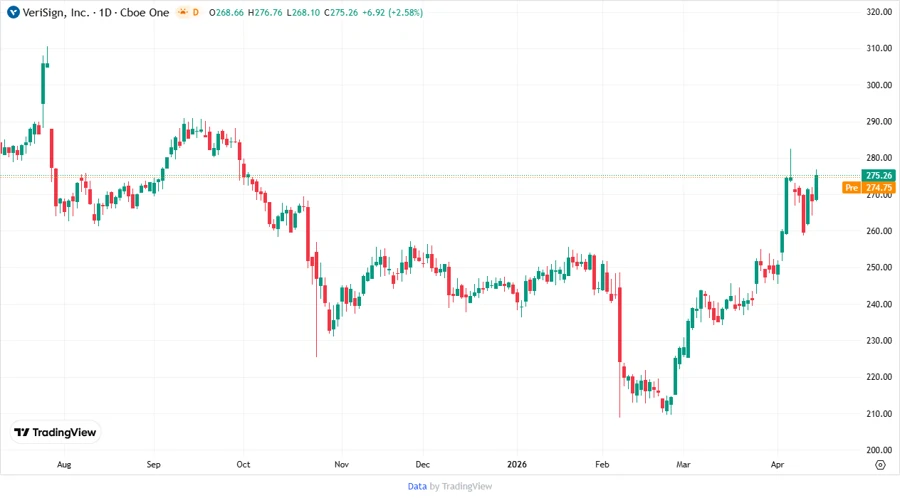
📉 Price Development
🗣️ Dividend Scoring System
| Criteria | Score (1-5) | |
|---|---|---|
| Dividend Yield | 3 | |
| Dividend Stability | 2 | |
| Dividend Growth | 1 | |
| Payout Ratio | 4 | |
| Financial Stability | 3 | |
| Dividend Continuity | 2 | |
| Cashflow Coverage | 4 | |
| Balance Sheet Quality | 3 |
Total Score: 22/40
✅ Rating
VeriSign, Inc. presents a mixed profile for income investors. Its conservative payout ratios and reliable cash flow management are favorable, albeit against a backdrop of declining dividend growth. Potential investors should weigh these factors, focusing on long-term financials and capital allocation strategy for growth and stability.