PNR: Dividend Analysis - Pentair plc

PNR: In-depth analysis of a company's dividend stability and key fundamental ratios to assess its financial strength and long-term investment potential.
July 09, 2026 a 03:31 pm
LOW: Fibunacci Level Technical Analysis - Lowes Companies Inc
LOW: Fibonacci retracement levels to identify key potential support and resistance zones, based on recent price trends.
July 09, 2026 a 03:15 pm
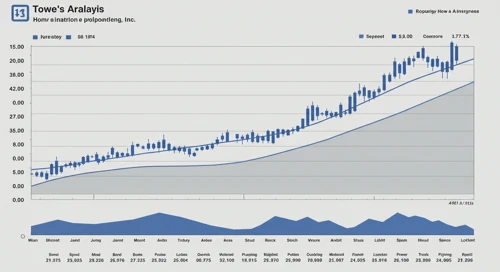
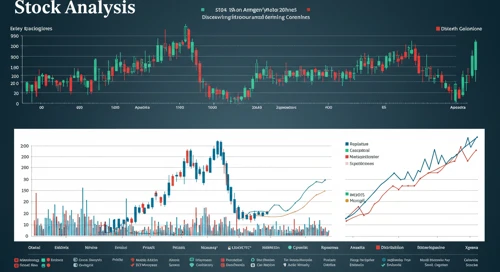
Financials Comparison. 09 Jul

Comparison of Financials. Where is strength and weakness? What has developed well and badly?
July 09, 2026 a 03:12 pm
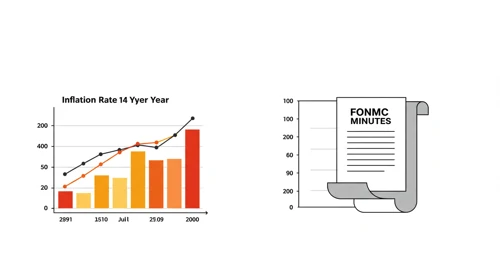
Todays Important Key Figures 09 Jul
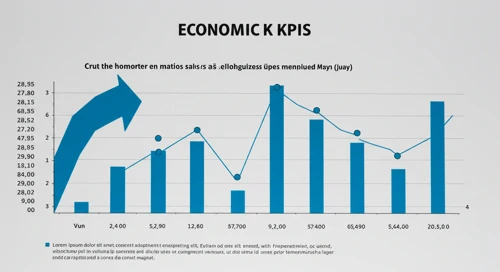
Today’s important economic data releases – a snapshot of key indicators influencing markets and shaping financial expectations.
July 09, 2026 a 03:00 pm
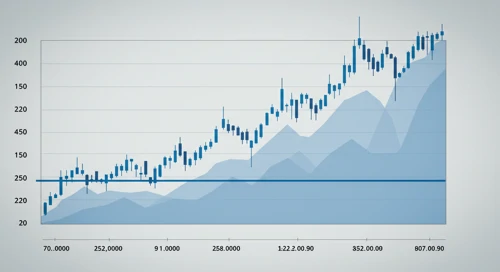
PWR: Trend with Support and Resistance Levels - Quanta Services Inc

PWR: Current price trend is evaluated alongside key support and resistance level. View of potential turning points and price momentum.
July 09, 2026 a 02:03 pm
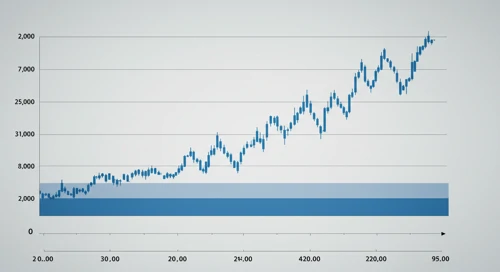
AMAT: Trend with Support and Resistance Levels - Applied Materials Inc

AMAT: Current price trend is evaluated alongside key support and resistance level. View of potential turning points and price momentum.
July 09, 2026 a 01:15 pm
VEEV: Fundamental Ratio Analysis - Veeva Systems Inc

VEEV: Evaluation of key financial ratios, analyst ratings, and price targets. A data-driven perspective on the valuation and market expectations.
July 09, 2026 a 01:00 pm

CI: Analysts Ratings - Cigna Corporation
July 09, 2026 a 05:00 pm
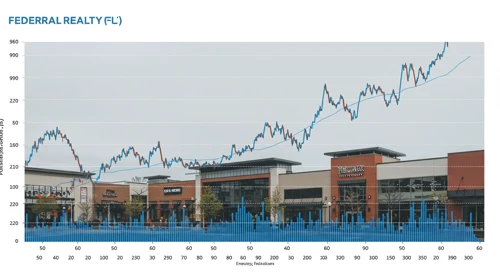
FRT: Fibunacci Level Technical Analysis - Federal Realty Investment Trust
July 09, 2026 a 04:44 pm

PODD: Analysts Ratings - Insulet Corp
July 09, 2026 a 04:39 pm

EXC: Fundamental Ratio Analysis - Exelon Corporation
July 09, 2026 a 03:43 pm
PANW: Analysts Ratings - Palo Alto Networks Inc
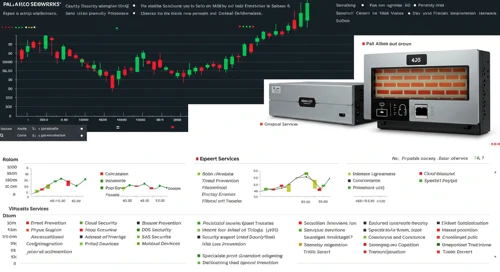
PANW: Comprehensive breakdown of current and historical analyst ratings, offering insights into how expert sentiment has evolved over time.
July 09, 2026 a 01:00 pm
SW: Analysts Ratings - Smurfit Westrock plc

SW: Comprehensive breakdown of current and historical analyst ratings, offering insights into how expert sentiment has evolved over time.
July 09, 2026 a 12:38 pm
Bonds Comparison. 09 Jul

Comparison of Bonds. Where is strength and weakness? What has developed well and badly?
July 09, 2026 a 12:31 pm
MPWR: Fibunacci Level Technical Analysis - Monolithic Power Systems Inc
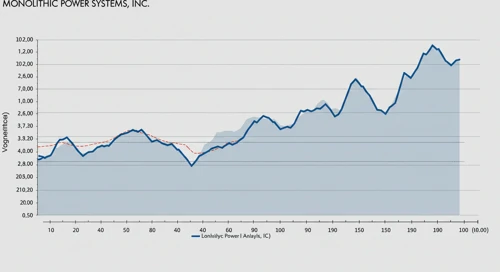
MPWR: Fibonacci retracement levels to identify key potential support and resistance zones, based on recent price trends.
July 09, 2026 a 11:44 am
APP: Fundamental Ratio Analysis - AppLovin Corporation

APP: Evaluation of key financial ratios, analyst ratings, and price targets. A data-driven perspective on the valuation and market expectations.
July 09, 2026 a 11:43 am
TKO: Dividend Analysis - TKO Group Holdings Inc

TKO: In-depth analysis of a company's dividend stability and key fundamental ratios to assess its financial strength and long-term investment potential.
July 09, 2026 a 11:31 am
CASY: Fibunacci Level Technical Analysis - Caseys General Stores Inc
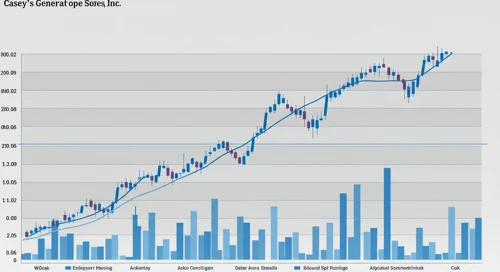
CASY: Fibonacci retracement levels to identify key potential support and resistance zones, based on recent price trends.
July 09, 2026 a 10:15 am
Stock Market - Heatmap
Use mouse wheel to zoom in and out. Click a ticker to display detailed information in a new window. Hover mouse cursor over a ticker to see more data.
Stock's
DOV: Fundamental Ratio Analysis - Dover Corporation

DOV: Evaluation of key financial ratios, analyst ratings, and price targets. A data-driven perspective on the valuation and market expectations.
July 09, 2026 a 07:43 am
HSY: Dividend Analysis - The Hershey Company

HSY: In-depth analysis of a company's dividend stability and key fundamental ratios to assess its financial strength and long-term investment potential.
July 09, 2026 a 07:31 am
AEP: Fibunacci Level Technical Analysis - American Electric Power Company Inc

AEP: Fibonacci retracement levels to identify key potential support and resistance zones, based on recent price trends.
July 09, 2026 a 06:44 am
EXC: Fibunacci Level Technical Analysis - Exelon Corporation
EXC: Fibonacci retracement levels to identify key potential support and resistance zones, based on recent price trends.
July 09, 2026 a 05:15 am
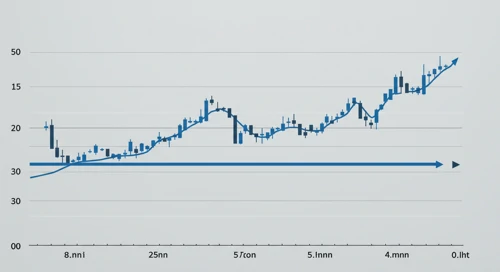
BAC: Trend with Support and Resistance Levels - Bank of America Corporation

BAC: Current price trend is evaluated alongside key support and resistance level. View of potential turning points and price momentum.
July 09, 2026 a 04:03 am
COR: Dividend Analysis - Cencora Inc
COR: In-depth analysis of a company's dividend stability and key fundamental ratios to assess its financial strength and long-term investment potential.
July 09, 2026 a 03:30 am
FDXF: Trend with Support and Resistance Levels - FedEx Freight Holding Company Inc
FDXF: Current price trend is evaluated alongside key support and resistance level. View of potential turning points and price momentum.
July 09, 2026 a 03:15 am
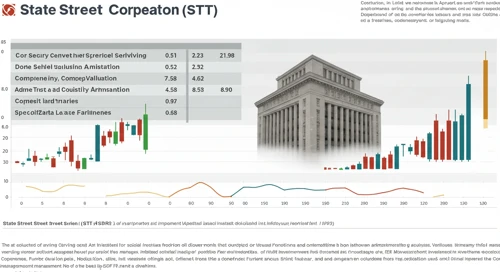
STT: Analysts Ratings - State Street Corporation
July 09, 2026 a 09:00 am

HSY: Analysts Ratings - The Hershey Company
July 09, 2026 a 08:38 am

MLM: Trend with Support and Resistance Levels - Martin Marietta Materials Inc
July 09, 2026 a 08:15 am

FOXA: Fundamental Ratio Analysis - Fox Corporation
July 09, 2026 a 08:00 am
SBUX: Analysts Ratings - Starbucks Corporation
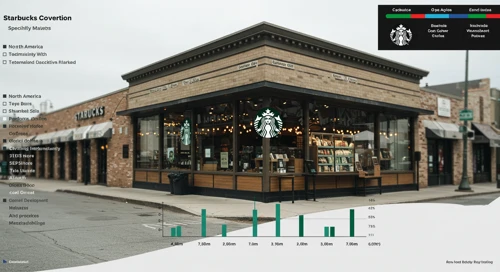
SBUX: Comprehensive breakdown of current and historical analyst ratings, offering insights into how expert sentiment has evolved over time.
July 08, 2026 a 09:00 pm
CRL: Analysts Ratings - Charles River Laboratories International Inc
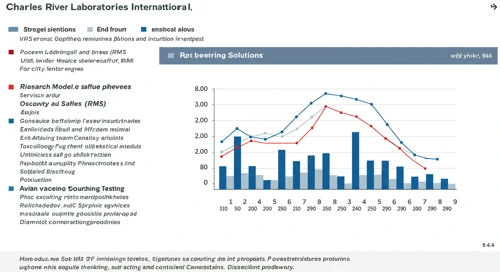
CRL: Comprehensive breakdown of current and historical analyst ratings, offering insights into how expert sentiment has evolved over time.
July 08, 2026 a 08:38 pm
CI: Fundamental Ratio Analysis - Cigna Corporation

CI: Evaluation of key financial ratios, analyst ratings, and price targets. A data-driven perspective on the valuation and market expectations.
July 08, 2026 a 07:43 pm
JNJ: Fundamental Ratio Analysis - Johnson and Johnson
JNJ: Evaluation of key financial ratios, analyst ratings, and price targets. A data-driven perspective on the valuation and market expectations.
July 08, 2026 a 06:00 pm
AMGN: Analysts Ratings - Amgen Inc
AMGN: Comprehensive breakdown of current and historical analyst ratings, offering insights into how expert sentiment has evolved over time.
July 08, 2026 a 05:00 pm
WAT: Fibunacci Level Technical Analysis - Waters Corporation
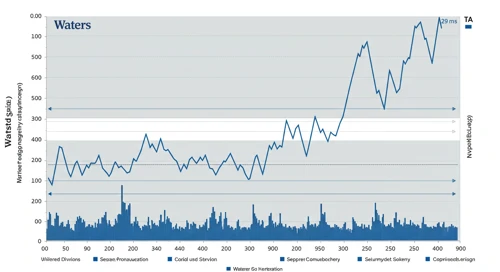
WAT: Fibonacci retracement levels to identify key potential support and resistance zones, based on recent price trends.
July 08, 2026 a 04:44 pm
AXP: Analysts Ratings - American Express Company

AXP: Comprehensive breakdown of current and historical analyst ratings, offering insights into how expert sentiment has evolved over time.
July 08, 2026 a 04:38 pm
Economic Calendar
Currencies
USDCAD: Trend with Support and Resistance Levels

USDCAD: Current price trend is evaluated alongside key support and resistance level. View of potential turning points and price momentum.
July 08, 2026 a 04:28 am
Todays Important Key Figures 07 Jul

Today’s important economic data releases – a snapshot of key indicators influencing markets and shaping financial expectations.
July 07, 2026 a 07:00 pm
GBPAUD: Fibunacci Level Technical Analysis

GBPAUD: Fibonacci retracement levels to identify key potential support and resistance zones, based on recent price trends.
July 07, 2026 a 05:08 am
NZDJPY: Trend with Support and Resistance Levels
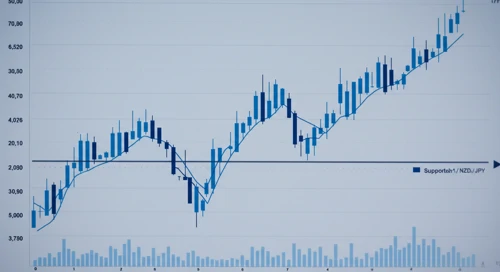
NZDJPY: Current price trend is evaluated alongside key support and resistance level. View of potential turning points and price momentum.
July 07, 2026 a 04:28 am
Important Key Figures of the last Days

Overview of key economic indicators released over the past days, highlighting their potential impact on markets and investor sentiment.
July 07, 2026 a 02:31 am
Todays Important Key Figures 06 Jul

Today’s important economic data releases – a snapshot of key indicators influencing markets and shaping financial expectations.
July 06, 2026 a 07:00 pm
EURJPY: Fibunacci Level Technical Analysis

EURJPY: Fibonacci retracement levels to identify key potential support and resistance zones, based on recent price trends.
July 06, 2026 a 05:08 am
CADJPY: Fibunacci Level Technical Analysis
July 09, 2026 a 05:08 am

Important Key Figures of the last Days
July 09, 2026 a 02:31 am
Todays Important Key Figures 08 Jul
July 08, 2026 a 07:00 pm
AUDCAD: Fibunacci Level Technical Analysis
July 08, 2026 a 05:08 am
GBPCAD: Trend with Support and Resistance Levels

GBPCAD: Current price trend is evaluated alongside key support and resistance level. View of potential turning points and price momentum.
July 06, 2026 a 04:28 am
AUDJPY: Fibunacci Level Technical Analysis
AUDJPY: Fibonacci retracement levels to identify key potential support and resistance zones, based on recent price trends.
July 05, 2026 a 05:08 am
EURGBP: Trend with Support and Resistance Levels

EURGBP: Current price trend is evaluated alongside key support and resistance level. View of potential turning points and price momentum.
July 05, 2026 a 04:28 am
GBPSEK: Fibunacci Level Technical Analysis
GBPSEK: Fibonacci retracement levels to identify key potential support and resistance zones, based on recent price trends.
July 04, 2026 a 05:08 am
USDCHF: Trend with Support and Resistance Levels
USDCHF: Current price trend is evaluated alongside key support and resistance level. View of potential turning points and price momentum.
July 04, 2026 a 04:28 am
Todays Important Key Figures 04 Jul

Today’s important economic data releases – a snapshot of key indicators influencing markets and shaping financial expectations.
July 03, 2026 a 11:00 pm
Todays Important Key Figures 03 Jul

Today’s important economic data releases – a snapshot of key indicators influencing markets and shaping financial expectations.
July 03, 2026 a 07:00 pm
Currencies