
July 09, 2026 a 05:08 am
CADJPY: Fibonacci Analysis
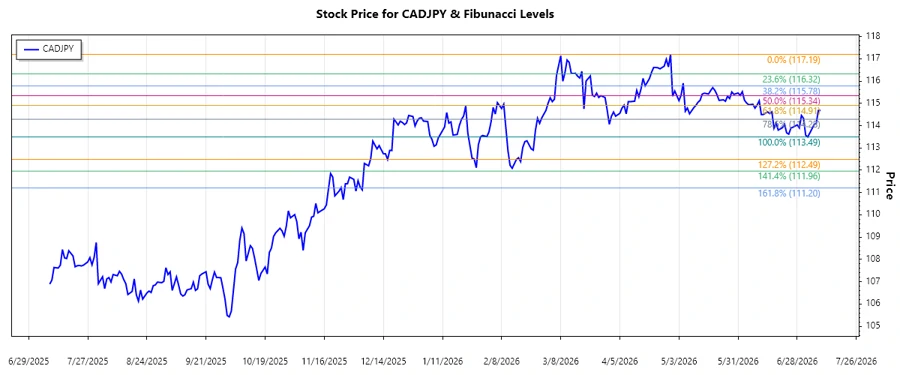
CADJPY has experienced an overall downtrend in the past few months. The pair saw a notable increase in volatility, with various factors like economic indicators and market sentiment playing essential roles. As the currency pair navigates through uncertain times, it is important to consider potential levels of support and resistance based on historical trends.
Fibonacci Analysis
| Analysis Detail | Information |
|---|---|
| Start Date | 2026-04-29 |
| End Date | 2026-07-09 |
| High Price & Date | 117.194 on 2026-04-29 |
| Low Price & Date | 113.492 on 2026-07-03 |
| Fibonacci Level | Price Level |
|---|---|
| 0.236 | 116.327 |
| 0.382 | 115.661 |
| 0.5 | 115.343 |
| 0.618 | 115.025 |
| 0.786 | 114.556 |
The current price is not within a significant Fibonacci retracement zone. The recent fall might find support around the 114.556 level, a critical observation for potential bullish correction.
The technical analysis suggests a likely resistance around the 0.5 retracement level (115.343), indicating that a breakout above this zone may signal a trend change or corrective rally.
Conclusion
The CADJPY currency pair is presently observing a downtrend, showcasing risks for traders focusing on long positions. Despite the downward pressure, possible supports show promise for short-term rebounds, specifically around the 114.556 level. However, traders should remain cautious about resistance levels, notably near 115.343. Analysts must consider external macroeconomic factors that could influence this pairing. The given levels provide a framework for anticipating potential reversals, allowing for strategic entry and exit when trading CADJPY.
Smart Data Insight
Master the Perfect Entry & Exit for this Stock
Don't leave your profits to chance. Historically, this stock follows specific seasonal patterns that institutional traders use to maximize returns.
- ✅ Identify the "Golden Buying Window"
- ✅ Avoid high-risk correction cycles
- ✅ Backtested data from the last 20+ years