
July 09, 2026 a 03:30 am


COR: Dividend Analysis - Cencora, Inc.
Cencora, Inc. shows a consistent history of dividend payments, reflecting its stable financial footing and predictable cash flow. With 26 years of unbroken dividend history, the firm highlights strong shareholder value commitments. Despite a yield of 0.91%, which is moderate, the company's management ensures a prudent payout ratio, offering safety and potential growth in distributions. The EPS payout ratio is notably low at 17.21%, supporting capacity for future increases. This analysis reveals the company's robust financial management and strategic growth potential, appealing to investors seeking dependable income streams.
📊 Overview
The following table outlines the key dividend-related metrics for Cencora, Inc., revealing its sector positioning, current yield, and dividend sustainability over time.
| Attribute | Details |
|---|---|
| Sector | N/A |
| Dividend yield | 0.91 % |
| Current dividend per share | 2.26 USD |
| Dividend history | 26 years |
| Last cut or suspension | None |
📜 Dividend History
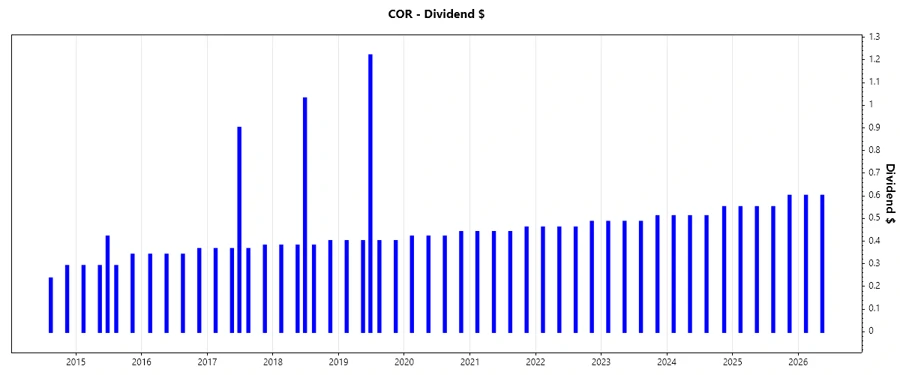
Cencora's enduring 26-year dividend payment track signifies financial resilience. Sustained dividend payments underline the firm’s reliable earnings and cash flow management. Investors often view a stable dividend history as indicative of financial health, potentially enhancing stock value stability. Below is a chart showcasing historic dividends:
| Year | Dividend per Share (USD) |
|---|---|
| 2026 | 1.20 |
| 2025 | 2.25 |
| 2024 | 2.08 |
| 2023 | 1.97 |
| 2022 | 1.87 |
📈 Dividend Growth
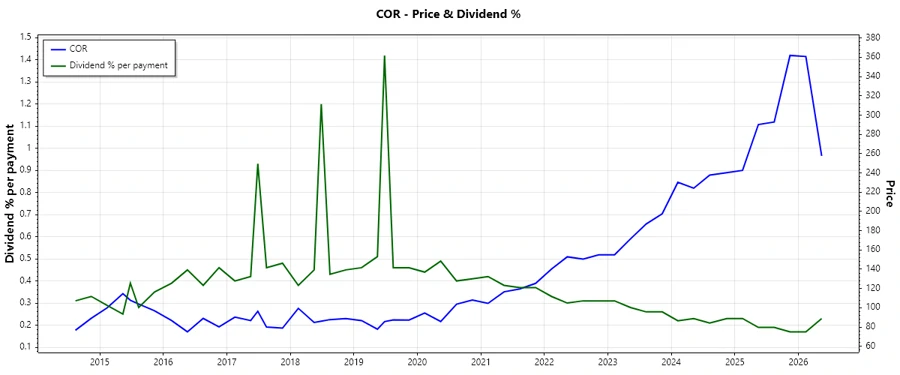
Dividend growth is a significant metric for evaluating future potential income increases. A growth rate of 6.46% over the past three years and 5.77% over the past five years illustrates Cencora’s commitment to enhancing shareholder returns. This growth signifies the firm's profitability and its confidence in future earnings.
| Time | Growth |
|---|---|
| 3 years | 6.46 % |
| 5 years | 5.77 % |
The average dividend growth is 5.77% over 5 years, indicating moderate yet steady dividend enhancement.
🏦 Payout Ratio
Payout ratios provide insights into a company's capacity to maintain dividend distributions. The EPS-based payout ratio of 17.21% suggests that earnings cover dividends comfortably, while a free cash flow-based ratio of 28.16% indicates prudent cash management, minimizing risks of dividend cuts.
| Key figure | Ratio |
|---|---|
| EPS-based | 17.21 % |
| Free cash flow-based | 28.16 % |
These metrics highlight the robust financial structure, with Cencora retaining significant flexibility for future dividend growth or strategic investments.
💸 Cashflow & Capital Efficiency
Cash flow stability and capital efficiency are crucial in assessing a company's ability to sustain operations and manage future growth. Cencora showcases effective cash flow utilization, indicative of strong operational prowess and potential for further dividend increments. Analysis of the cash flow metrics reveals a solid foundation for supporting growth investments and shareholder returns.
| Year | 2025 | 2024 | 2023 |
|---|---|---|---|
| Free Cash Flow Yield | 5.29% | 6.71% | 9.38% |
| Earnings Yield | 2.57% | 3.38% | 4.74% |
| CAPEX to Operating Cash Flow | 17.24% | 13.98% | 11.72% |
| Stock-based Compensation to Revenue | 0.046% | 0.050% | 0.048% |
| Free Cash Flow / Operating Cash Flow Ratio | 82.76% | 86.02% | 88.28% |
This evaluation indicates that Cencora efficiently allocates capital, fostering long-term shareholder value through effective cash management.
⚖️ Balance Sheet & Leverage Analysis
A thorough analysis of balance sheets and leverage ratios reflects a company's financial stability and debt management efficiency. Cencora's metrics demonstrate a cautious approach to leverage, ensuring manageable debt levels against equity and assets.
| Year | 2025 | 2024 | 2023 |
|---|---|---|---|
| Debt-to-Equity | 7.13 | 10.30 | 13.06 |
| Debt-to-Assets | 14.03% | 9.91% | 10.90% |
| Debt-to-Capital | 87.70% | 91.15% | 92.89% |
| Net Debt to EBITDA | 1.70 | 1.02 | 1.21 |
| Current Ratio | 0.90 | 0.88 | 0.88 |
| Quick Ratio | 0.55 | 0.53 | 0.52 |
| Financial Leverage | 50.79 | 103.88 | 119.84 |
The analysis suggests prudent financial management with a sustainable leverage model, maintaining a healthy balance for growth and risk mitigation.
🔍 Fundamental Strength & Profitability
Evaluating fundamental strength and profitability reveals potential for future growth and value creation. Cencora demonstrates strong returns on equity and assets, with reliable profitability margins, emphasizing efficient operations and market positioning.
| Year | 2025 | 2024 | 2023 |
|---|---|---|---|
| Return on Equity | 1.03% | 2.34% | 3.34% |
| Return on Assets | 2.03% | 2.25% | 2.79% |
| Net Margin | 0.48% | 0.51% | 0.67% |
| EBIT Margin | 0.83% | 0.76% | 0.93% |
| EBITDA Margin | 1.16% | 1.14% | 1.30% |
| Gross Margin | 3.16% | 2.96% | 2.96% |
| Research & Development to Revenue | 0.00% | 0.00% | 0.00% |
Analysis of these metrics confirms that Cencora maintains profitability while optimizing resource allocation, underpinning its competitive edge.
📉 Price Development
🏆 Dividend Scoring System
This scoring system evaluates key dividend investment metrics on a scale from 1 to 5. The criteria cover dividend characteristics and company financial health, providing a holistic view of Cencora, Inc.'s dividend appeal.
| Criteria | Score | Bar |
|---|---|---|
| Dividend yield | 3 | |
| Dividend Stability | 4 | |
| Dividend growth | 4 | |
| Payout ratio | 5 | |
| Financial stability | 4 | |
| Dividend continuity | 5 | |
| Cashflow Coverage | 5 | |
| Balance Sheet Quality | 3 |
Total Score: 33/40
⭐ Rating
With compelling dividend attributes and overall financial strength, Cencora, Inc. offers a moderately attractive dividend investment opportunity. Its consistent dividend growth and low payout ratios make it a suitable choice for income-focused investors desiring long-term capital appreciation alongside steady income. Overall, Cencora's diversified financial strategies and sound capital management position it favorably in the market, signaling prudent hold or buy decisions.
Smart Data Insight
Master the Perfect Entry & Exit for this Stock
Don't leave your profits to chance. Historically, this stock follows specific seasonal patterns that institutional traders use to maximize returns.
- ✅ Identify the "Golden Buying Window"
- ✅ Avoid high-risk correction cycles
- ✅ Backtested data from the last 20+ years