
July 06, 2026 a 04:28 am

GBPCAD: Trend and Support & Resistance Analysis
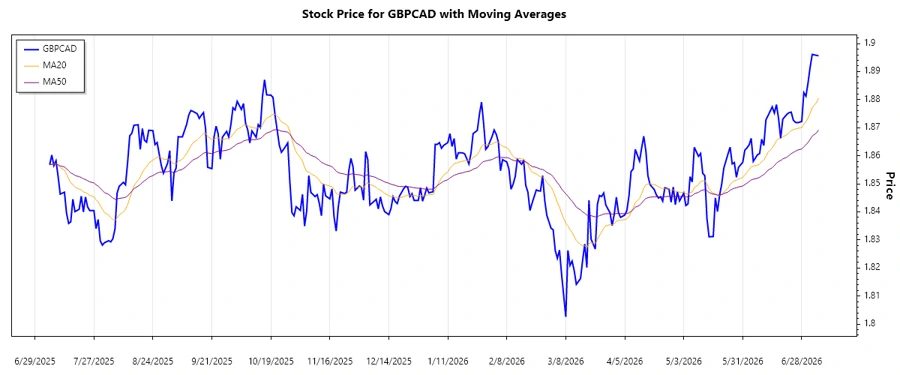
The GBPCAD currency pair has shown volatility over the last few months, with recent movements indicating a potential shift in trend. As of the latest data, the trend dynamics have been mixed with subtle shifts suggesting an emergence of buying pressure. Analysts should monitor key levels for any potential breakouts or reversals.
Trend Analysis
Examining the recent data reveals a well-defined upward trend. The comparison of EMA values suggests a bullish momentum in the current period. Here is a detailed look at the data of the last 7 days:
| Date | Close Price | Trend |
|---|---|---|
| 2026-07-06 | 1.89564 | ▲ |
| 2026-07-05 | 1.89579 | ▲ |
| 2026-07-03 | 1.89613 | ▲ |
| 2026-07-02 | 1.89165 | ▲ |
| 2026-07-01 | 1.88602 | ▲ |
| 2026-06-30 | 1.88122 | ▲ |
| 2026-06-29 | 1.8825 | ▲ |
The trend analysis shows a consistent upward movement with EMA20 surpassing EMA50, indicating a continued bullish sentiment in the market. This momentum suggests a potential for further gains if current support levels hold.
Support and Resistance Zones
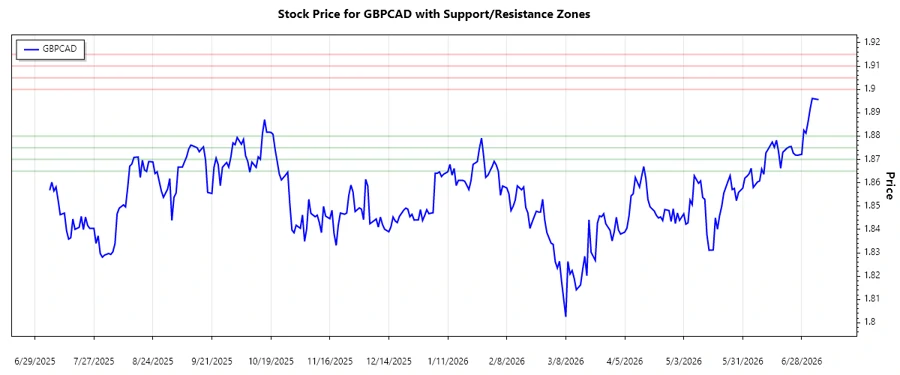
From the analysis of recent prices, two key support and resistance zones have been identified. These levels are crucial in determining possible breakout points or areas of retracement.
| Support Zone | Resistance Zone |
|---|---|
| 1.8750 - 1.8800 ▼ | 1.9000 - 1.9050 ▲ |
| 1.8650 - 1.8700 ▼ | 1.9100 - 1.9150 ▲ |
Currently, the price is approaching the first resistance zone. If breached, this may signal further bullish momentum, whereas failure to break could lead to a retracement towards support levels.
Conclusion
The analysis of GBPCAD suggests a positive outlook with current indications favoring a bullish trend. However, investors should remain cautious of any changes in market dynamics that could lead to shifts in key support and resistance levels. It is crucial to monitor these zones closely as they play an integral role in future price movements.
Smart Data Insight
Master the Perfect Entry & Exit for this Stock
Don't leave your profits to chance. Historically, this stock follows specific seasonal patterns that institutional traders use to maximize returns.
- ✅ Identify the "Golden Buying Window"
- ✅ Avoid high-risk correction cycles
- ✅ Backtested data from the last 20+ years