
July 09, 2026 a 11:43 am

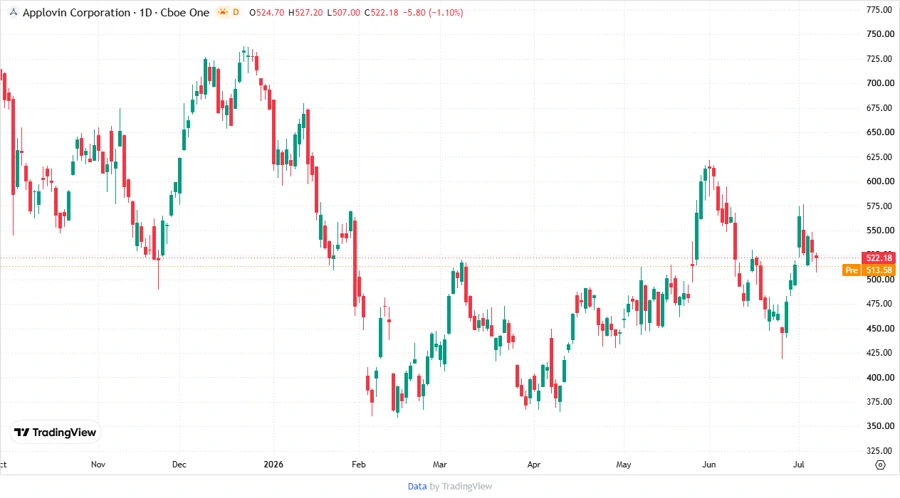
APP: Fundamental Ratio Analysis - AppLovin Corporation
AppLovin Corporation, symbol APP, operates in the dynamic tech sector, offering vital software solutions for app developers. Despite its robust software offerings, the current market environment presents both opportunities and challenges for AppLovin, as it navigates competitive pressures and technological advancements.
Fundamental Rating
The fundamental analysis gives AppLovin a decent standing with an overall 'B' rating. However, areas such as debt management might need improvement.
| Category | Score | Visualization |
|---|---|---|
| Discounted Cash Flow | 3 | |
| Return On Equity | 5 | |
| Return On Assets | 5 | |
| Debt To Equity | 1 | |
| Price To Earnings | 2 | |
| Price To Book | 1 |
Historical Rating
Reviewing historical scores gives insight into how AppLovin's valuation metrics have evolved over time.
| Date | Overall Score | DCF | ROE | ROA | Debt/Equity | P/E | P/B |
|---|---|---|---|---|---|---|---|
| 2026-07-08 | 3 | 3 | 5 | 5 | 1 | 2 | 1 |
| Previous | 0 | 3 | 5 | 5 | 1 | 2 | 1 |
Analyst Price Targets
The analyst price targets reflect a broad consensus with potential for growth, though they also highlight possible volatility.
| High | Low | Median | Consensus |
|---|---|---|---|
| 835 | 340 | 665 | 660.59 |
Analyst Sentiment
Analysts remain optimistic about AppLovin, with a majority leaning towards a 'Buy' consensus.
| Recommendation | Count | Visualization |
|---|---|---|
| Strong Buy | 0 | |
| Buy | 23 | |
| Hold | 2 | |
| Sell | 1 | |
| Strong Sell | 0 |
Conclusion
AppLovin demonstrates promising potential in the app development sector, bolstered by its diverse software offerings. While the company maintains a solid 'Buy' analyst consensus, investors should remain vigilant about potential market fluctuations and debt management. The historical ratings underscore consistent performance, placing future focus on enhancing debt handling. By leveraging its strengths in analytics and bidding solutions, AppLovin is well-positioned to capture more market share. However, mindful navigation through competitive landscapes remains pivotal.
Smart Data Insight
Master the Perfect Entry & Exit for this Stock
Don't leave your profits to chance. Historically, this stock follows specific seasonal patterns that institutional traders use to maximize returns.
- ✅ Identify the "Golden Buying Window"
- ✅ Avoid high-risk correction cycles
- ✅ Backtested data from the last 20+ years