
July 08, 2026 a 04:44 pm
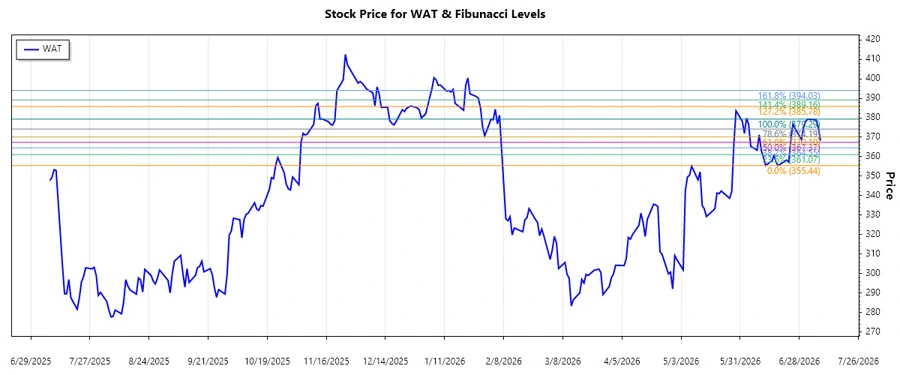
WAT: Fibonacci Analysis - Waters Corporation
Waters Corporation showcases an impressive resilience in its financial performance over recent months. Despite the volatility in market conditions, the company has maintained a consistent growth trajectory in its stock prices. This stability highlights investors' confidence in Waters' capability to innovate and adapt within the specialized measurement field. Waters Corporation has shown potential for continued growth given the ongoing demand for analytical solutions across various industries, making it a strong contender for long-term investment portfolios.
Fibonacci Analysis
| Attribute | Details |
|---|---|
| Trend Start Date | 2026-06-09 |
| Trend End Date | 2026-07-08 |
| High Price | 379.29 (2026-07-02) |
| Low Price | 355.44 (2026-06-18) |
| Fibonacci Level 0.236 | 360.97 |
| Fibonacci Level 0.382 | 364.98 |
| Fibonacci Level 0.5 | 367.37 |
| Fibonacci Level 0.618 | 369.75 |
| Fibonacci Level 0.786 | 374.50 |
| Current Retracement Level | 0.382 |
| Interpretation | The current price is testing the 0.382-level, suggesting potential support and the possibility of a price reversal. |
Conclusion
Waters Corporation demonstrates a solid recent uptrend, reflecting investor confidence. The current engagement at the 0.382 Fibonacci retracement level indicates possible stabilization and offers a potential buying opportunity should the price rebound. However, careful monitoring is warranted as breaking below this level could signal further downside risk. The presence in critical growth sectors coupled with consistent financial metrics enhances the company's position, yet market volatility and competitive pressures remain inherent risks. Analysts must weigh these elements to optimize strategic decisions appropriately.
Smart Data Insight
Master the Perfect Entry & Exit for this Stock
Don't leave your profits to chance. Historically, this stock follows specific seasonal patterns that institutional traders use to maximize returns.
- ✅ Identify the "Golden Buying Window"
- ✅ Avoid high-risk correction cycles
- ✅ Backtested data from the last 20+ years