
July 09, 2026 a 02:03 pm

PWR: Trend and Support & Resistance Analysis - Quanta Services, Inc.
Quanta Services, Inc. is a prominent player in the specialized contracting solutions sector, providing diversified services across electric power, telecommunications, and renewable energy. Recent technical indicators suggest the stock is in an interesting phase, potentially offering opportunities for traders on both the support and resistance fronts. Key analyses reveal current trends and zones worth monitoring.
Trend Analysis
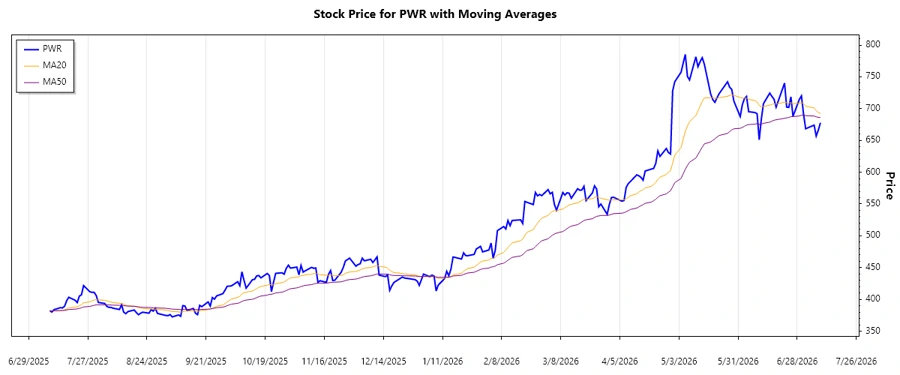
The analysis of Quanta Services, Inc. (PWR) over the last few months indicates a volatile trend, balancing between gains and losses. Recent calculations of EMA20 and EMA50 reveal a downward pattern, suggesting a bearish market sentiment.
| Date | Close Price | Trend Direction |
|---|---|---|
| 2026-07-09 | 677.70 | ▲ |
| 2026-07-08 | 666.33 | ▼ |
| 2026-07-07 | 656.79 | ▼ |
| 2026-07-06 | 674.04 | ▲ |
| 2026-07-02 | 668.31 | ▼ |
| 2026-07-01 | 691.40 | ▲ |
| 2026-06-30 | 720.04 | ▲ |
The downward EMA trend indicates potential bearishness. This could imply cautious trading ahead as the stock may encounter more price contractions.
Support- and Resistance
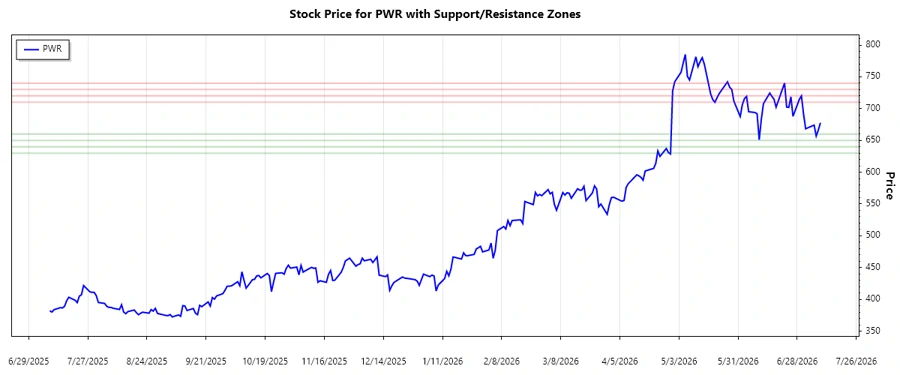
Identified support and resistance zones highlight critical price levels Quanta Services, Inc. is currently navigating. Calculations indicate the relevance of these zones for potential reversal or continuation patterns.
| Zone Type | From | To | |
|---|---|---|---|
| Resistance 1 | 710.00 | 720.00 | ▲ |
| Resistance 2 | 730.00 | 740.00 | ▲ |
| Support 1 | 650.00 | 660.00 | ▼ |
| Support 2 | 630.00 | 640.00 | ▼ |
Currently, the stock is oscillating near the lower resistance zone, which might indicate upcoming downward pressure. Traders can expect fluctuations within these identified boundaries before any significant breakouts.
Conclusion
The technical analysis of Quanta Services, Inc. (PWR) paints a cautious picture with prevailing bearish undertones. The observed trend and current positioning within support and resistance zones suggest potential volatility ahead. While recovery in stock price to higher levels isn’t imminent, the stock’s critical positioning indicates potential trading opportunities for the risk-tolerant. Analysts should remain vigilant concerning any external market influences impacting the price trajectory, ensuring a flexible trading strategy aligned with emerging patterns.
Smart Data Insight
Master the Perfect Entry & Exit for this Stock
Don't leave your profits to chance. Historically, this stock follows specific seasonal patterns that institutional traders use to maximize returns.
- ✅ Identify the "Golden Buying Window"
- ✅ Avoid high-risk correction cycles
- ✅ Backtested data from the last 20+ years