
July 09, 2026 a 03:12 pm


Financial Stocks - Performance Analysis
In the ever-evolving landscape of financial markets, the latest performance metrics for leading stocks in the financial sector reveal intriguing trends. Over the past week, month, and quarter, fluctuations are directly influenced by market conditions, policy changes, and broader economic indicators. By examining the short-term and mid-term performance, investors can better strategize their portfolio management amid dynamic market conditions.
📊 Financial Stocks Performance One Week
| Stock | Performance (%) | Performance |
|---|---|---|
| AXP | -4.42% | |
| VISA | -4.09% | |
| MA | -3.66% | |
| BRK.B | -2.58% | |
| SPGI | -2.03% | |
| JPM | -1.13% | |
| BAC | -0.69% | |
| PGR | 0.30% | |
| WFC | 0.10% | |
| GS | 0.91% |
📊 Financial Stocks Performance One Month
| Stock | Performance (%) | Performance |
|---|---|---|
| PGR | 15.53% | |
| BAC | 7.05% | |
| VISA | 6.90% | |
| JPM | 5.80% | |
| AXP | 5.77% | |
| WFC | 4.47% | |
| MA | 5.07% | |
| SPGI | 1.91% | |
| BRK.B | 1.52% | |
| GS | 0.12% |
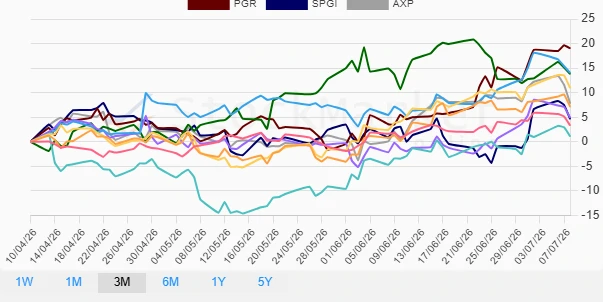
📊 Financial Stocks Performance Three Months
| Stock | Performance (%) | Performance |
|---|---|---|
| PGR | 19.03% | |
| VISA | 14.04% | |
| GS | 13.81% | |
| BAC | 10.91% | |
| AXP | 7.80% | |
| JPM | 7.10% | |
| MA | 4.89% | |
| SPGI | 4.62% | |
| BRK.B | 3.30% | |
| WFC | 1.07% |
✅ Summary
The analysis of financial stocks over varying timeframes indicates a vibrant yet volatile market environment. Within the week, American Express and Visa underperformed, possibly reflecting short-term market volatility or reaction to recent economic news. Conversely, Progressive exhibited substantial growth over the longer monthly and quarterly periods, suggesting a robust business model and operational success. This performance pattern underscores the importance of diversified portfolio management, adapting to both short-term market fluctuations and long-term growth opportunities. Investors should consider both macroeconomic conditions and sector-specific developments when strategizing their investments in the financial sector.
Smart Data Insight
Master the Perfect Entry & Exit for this Stock
Don't leave your profits to chance. Historically, this stock follows specific seasonal patterns that institutional traders use to maximize returns.
- ✅ Identify the "Golden Buying Window"
- ✅ Avoid high-risk correction cycles
- ✅ Backtested data from the last 20+ years