
July 08, 2026 a 05:08 am
AUDCAD: Fibonacci Analysis
The AUDCAD currency pair has shown significant movements, indicative of market sentiment and potential economic impacts between Australia and Canada. Recent trends reveal the influence of economic data releases, commodity price fluctuations, and prevailing interest rate policies. Understanding these shifts helps identify future market opportunities and risks.
Fibonacci Analysis
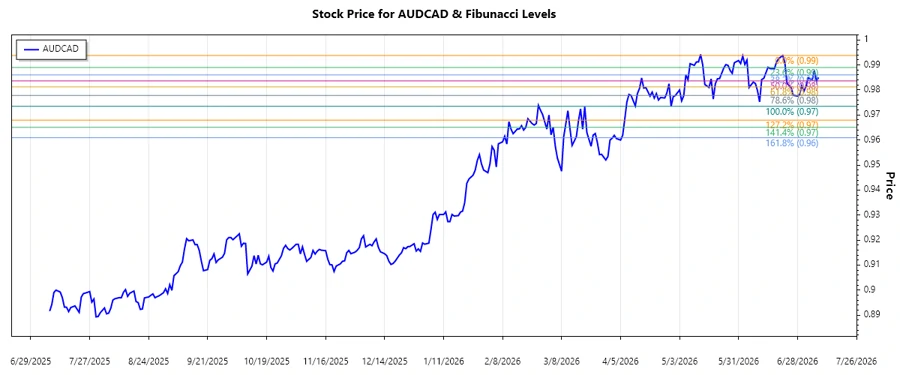
The recent AUDCAD movement showcases a downward trend, starting from a high point at 0.99379 on June 21, 2026, down to a low of 0.97347 on April 29, 2026. This relatively recent downtrend provides a basis for Fibonacci analysis to identify key retracement levels.
| Trend Details | Values |
|---|---|
| Start Date | 2026-06-21 |
| End Date | 2026-04-29 |
| High (Price, Date) | 0.99379, June 21, 2026 |
| Low (Price, Date) | 0.97347, April 29, 2026 |
| Fibonacci Level | Price |
|---|---|
| 0.236 | 0.97813 |
| 0.382 | 0.98139 |
| 0.500 | 0.98513 |
| 0.618 | 0.98886 |
| 0.786 | 0.99302 |
Currently, the price of AUDCAD is approximately 0.98499, residing just below the 0.5 Fibonacci retracement level, indicating potential resistance.
This area may act as a critical resistance, signaling a possible continuation of the downtrend if the price doesn't breach above.
Conclusion
The AUDCAD pair's recent price action and its proximity to Fibonacci levels suggest a cautious outlook. The resistance at the 0.5 retracement hints at a potential downward continuation unless decisively breached. Analysts should monitor this zone closely for signals of reversal or further decline. Considering the broader economic conditions affecting both countries, there's a balance between upside potential from economic recovery and downside risks from global instability.
Smart Data Insight
Master the Perfect Entry & Exit for this Stock
Don't leave your profits to chance. Historically, this stock follows specific seasonal patterns that institutional traders use to maximize returns.
- ✅ Identify the "Golden Buying Window"
- ✅ Avoid high-risk correction cycles
- ✅ Backtested data from the last 20+ years