
July 09, 2026 a 11:31 am

TKO: Dividend Analysis - TKO Group Holdings, Inc.
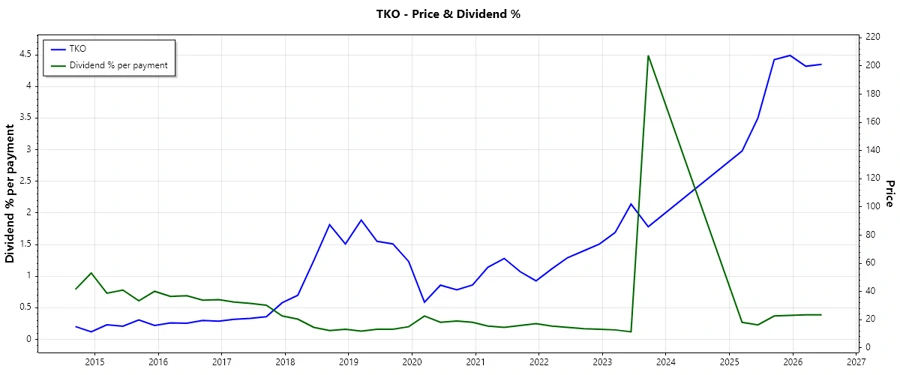
TKO Group Holdings, Inc. boasts a moderate dividend yield of 1.55%, offering investors consistent income alongside potential capital appreciation opportunities. Despite high EPS payout ratios, the company's cash flow coverage instills confidence in its continued ability to pay dividends. In this analysis, we dissect TKO's dividend reliability through its historical payouts and growth metrics, contextualizing its overall financial health and strategic positioning.
📊 Overview
| Parameter | Details |
|---|---|
| Sector | Media & Entertainment |
| Dividend yield | 1.55% |
| Current dividend per share | 7.93 USD |
| Dividend history | 23 years |
| Last cut or suspension | None |
🗣️ Dividend History
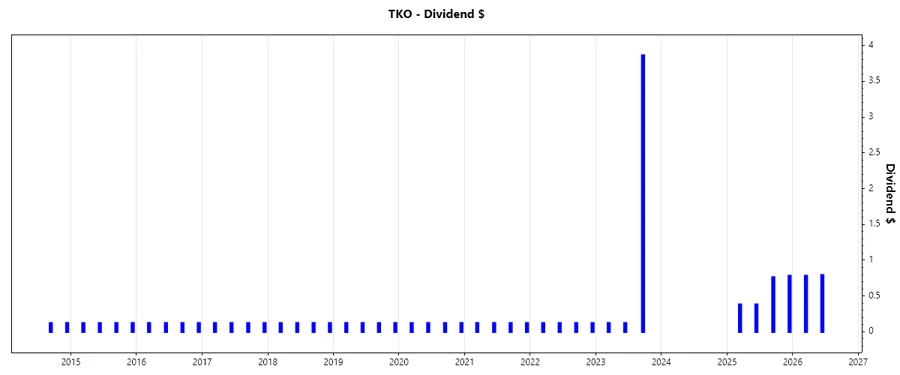
TKO Group has shown a resilient dividend history, with 23 years of consistent payments. This long-standing commitment highlights the company's strategic focus on rewarding shareholders, which is a key factor for income-oriented investors. Regular dividend payments also indicate the enterprise's financial health and its ability to generate sustainable cash flows.
| Year | Dividend per Share (USD) |
|---|---|
| 2026 | 1.57 |
| 2025 | 2.30 |
| 2023 | 4.10 |
| 2022 | 0.48 |
| 2021 | 0.48 |
📈 Dividend Growth
While short-term growth appears modest, with a 3-year growth rate of 0.69%, the 5-year period reflects at 0.37%, hinting at TKO's capacity for steady increases in dividend payments. Monitoring dividend growth offers insights into management's confidence in future earnings potential, aligning with shareholder value creation.
| Time | Growth |
|---|---|
| 3 years | 0.69% |
| 5 years | 0.37% |
The average dividend growth is 0.37% over 5 years. This shows moderate but steady dividend growth.
✅ Payout Ratio
The payout ratio, while elevated at 270.84% based on EPS, is substantially lower when assessed against free cash flow at 33.97%. This suggests TKO's ability to sustain its payouts, relying more on cash flow generation over accounting profits. Investors should scrutinize these figures as they provide an outlook on potential payout sustainability amidst earnings volatility.
| Key figure | Ratio |
|---|---|
| EPS-based | 270.84% |
| Free cash flow-based | 33.97% |
💸 Cashflow & Capital Efficiency
Efficient capital deployment is evident, with a Free Cash Flow Yield of 12.09% and an Earnings Yield of 1.52%, underscoring profitable reinvestment strategies. Additionally, manageable levels of CAPEX relative to operating cash flow (3.90%) further affirm TKO's disciplined investment approach. High stock-based compensation to revenue figures could indicate potential dilution concerns that need monitoring.
| 2023 | 2024 | 2025 | |
|---|---|---|---|
| Free Cash Flow Yield | 6.21% | 4.40% | 6.86% |
| Earnings Yield | -0.52% | 0.08% | 1.16% |
| CAPEX to Operating Cash Flow | 10.38% | 12.85% | 9.87% |
| Stock-based Compensation to Revenue | 3.41% | 3.37% | 0.00% |
| Free Cash Flow / Operating Cash Flow Ratio | 89.62% | 87.15% | 90.13% |
🏦 Balance Sheet & Leverage Analysis
With a debt-to-equity ratio of 1.09, TKO maintains a balanced capital structure, allowing flexibility to leverage growth when necessary. However, net debt to EBITDA levels at 2.21 are relatively high, indicating leveraged operational expansion. Metrics such as a current ratio of 1.28 and quick ratio of 1.26 depict favorable short-term liquidity positions, providing reassurance against immediate credit challenges.
| 2023 | 2024 | 2025 | |
|---|---|---|---|
| Debt-to-Equity | 1.09 | 0.74 | 1.09 |
| Debt-to-Assets | 0.24 | 0.24 | 0.26 |
| Debt-to-Capital | 0.52 | 0.43 | 0.52 |
| Net Debt to EBITDA | 2.22 | 3.71 | 2.47 |
| Current Ratio | 1.04 | 1.30 | 1.26 |
| Quick Ratio | 1.04 | 1.30 | 1.26 |
| Financial Leverage | 3.09 | 3.10 | 4.15 |
🛠️ Fundamental Strength & Profitability
TKO's profitability ratios, including a return on equity of 5% and return on assets of 1.41%, indicate moderate efficiency in generating returns from equity and assets. Margins have remained relatively consistent, a hallmark of operational stability. R&D allocations remain absent, suggesting a potential gap in innovation funding which could impact long-term growth perspectives.
| 2023 | 2024 | 2025 | |
|---|---|---|---|
| Return on Equity | -0.86% | 0.23% | 5.23% |
| Return on Assets | -0.28% | 0.07% | 1.26% |
| Net Profit Margin | -2.10% | 0.34% | 4.13% |
| Gross Profit Margin | 59.45% | 53.90% | 49.57% |
| EBIT Margin | 26.66% | 10.11% | 17.38% |
| EBITDA Margin | 36.48% | 24.12% | 27.62% |
| R&D to Revenue | 0% | 0% | 0% |
📉 Price Development
🏅 Dividend Scoring System
| Criteria | Score | Bar |
|---|---|---|
| Dividend yield | 3 | |
| Dividend Stability | 4 | |
| Dividend growth | 2 | |
| Payout ratio | 3 | |
| Financial stability | 3 | |
| Dividend continuity | 5 | |
| Cashflow Coverage | 4 | |
| Balance Sheet Quality | 3 |
Total Score: 27/40
🎯 Rating
Overall, TKO Group Holdings, Inc. presents a moderate dividend investment profile with a strong historical commitment to payouts. Despite high EPS-based payout ratios, the firm's strong cash flow coverage and strategic financial management enable sustained dividend distributions. This stock suits investors focused on steady income with potential for capital growth, though attention to innovation drivers is advisable for future resilience.
Smart Data Insight
Master the Perfect Entry & Exit for this Stock
Don't leave your profits to chance. Historically, this stock follows specific seasonal patterns that institutional traders use to maximize returns.
- ✅ Identify the "Golden Buying Window"
- ✅ Avoid high-risk correction cycles
- ✅ Backtested data from the last 20+ years