
July 05, 2026 a 04:28 am

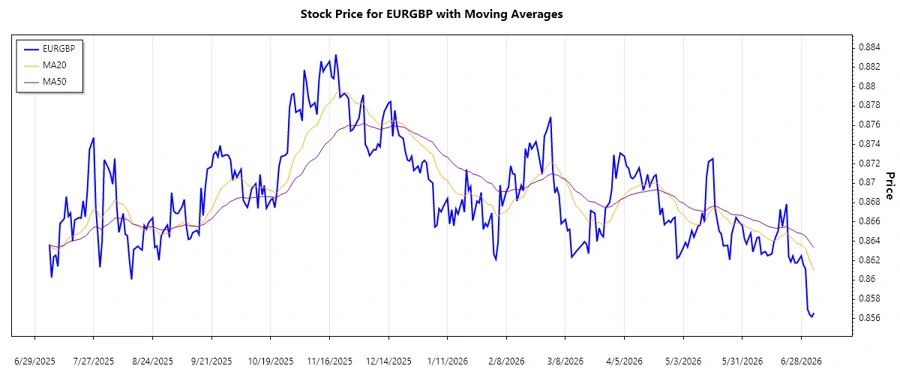

EURGBP: Trend and Support & Resistance Analysis
The EURGBP currency pair has recently been under scrutiny due to significant fluctuations that reflect on the European economy's relations with the UK market. Recent data patterns suggest that, while there was a period of relative stability, emerging trends highlight potential shifts in the near future. Traders and financial analysts should watch for key indicators, including resistance and support levels, to navigate the evolving landscape. As the analysis below indicates, understanding these trends can provide valuable insights for strategic decision-making.
Trend Analysis
| Date | Close | Trend |
|---|---|---|
| 2026-07-04 | 0.85659 | ▼ Downtrend |
| 2026-07-03 | 0.85618 | ▼ Downtrend |
| 2026-07-02 | 0.85641 | ▼ Downtrend |
| 2026-07-01 | 0.85695 | ▼ Downtrend |
| 2026-06-30 | 0.86114 | ▼ Downtrend |
| 2026-06-29 | 0.86156 | ▲ Uptrend |
| 2026-06-28 | 0.86249 | ▲ Uptrend |
The EMA analysis during the observed period suggests a predominant downtrend as EMA20 is less than EMA50. This current trend may indicate bearish sentiment, highlighting potential selling opportunities for traders.
Support- and Resistance
| Zone Type | From | To | |
|---|---|---|---|
| Support Zone 1 | 0.8560 | 0.8570 | ⬆️ |
| Support Zone 2 | 0.8540 | 0.8550 | ⬆️ |
| Resistance Zone 1 | 0.8610 | 0.8625 | ⬇️ |
| Resistance Zone 2 | 0.8630 | 0.8650 | ⬇️ |
The current close is sitting near a resistance level, suggesting potential selling pressure as the currency pair attempts to break higher but remains constrained.
Conclusion
The EURGBP currency pair presently exhibits a downward trend with the EMA analysis indicating a bearish market sentiment. Should the downward pressure persist, traders may find favorable opportunities to sell as the currency remains below significant resistance levels. Nevertheless, potential support zones point to levels of buying interest that could disrupt the downtrend. Continuous monitoring of these price levels and their respective breakouts or reversals is crucial for market participants.
Smart Data Insight
Master the Perfect Entry & Exit for this Stock
Don't leave your profits to chance. Historically, this stock follows specific seasonal patterns that institutional traders use to maximize returns.
- ✅ Identify the "Golden Buying Window"
- ✅ Avoid high-risk correction cycles
- ✅ Backtested data from the last 20+ years