
July 09, 2026 a 03:15 pm
LOW: Fibonacci Analysis - Lowe's Companies, Inc.
Lowe's Companies, Inc. has been a resilient player in the home improvement sector, showing a robust capacity to adapt to market dynamics. The stock has recently displayed a notable downward trend, despite temporary fluctuations. Investors and analysts are keenly observing the stock for potential rebound opportunities, as the company continues to explore new avenues to maintain growth and enhance shareholder value. The technical analysis below highlights key levels to watch based on recent trends.
Fibonacci Analysis
| Description | Details |
|---|---|
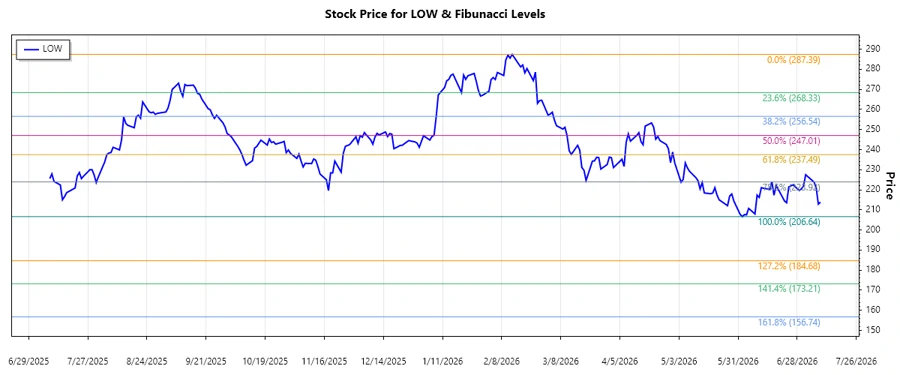
| Trend Period | 2026-02-13 to 2026-07-09 |
| High Point | $287.39 on 2026-02-13 |
| Low Point | $206.64 on 2026-06-02 |
| Fibonacci Levels |
|
| Current Price Status | Current price is $213.86, which is below the 0.236 retracement level. |
| Technical Interpretation | The current price is below the Fibonacci retracement levels, suggesting potential resistance at these levels as the price approaches them from below. |
Conclusion
The analysis of Lowe's Companies, Inc.'s stock indicates a prevailing downward trend from its peak earlier in the year. The stock is currently trading below significant Fibonacci levels, highlighting areas of potential resistance. The market outlook appears cautiously optimistic, with investors awaiting signs of reversal or continuation. The stock's performance may hinge on Lowe's strategic initiatives and broader market conditions. Analysts should watch for breaks above retracement levels for signs of strength or potential reversal.
Smart Data Insight
Master the Perfect Entry & Exit for this Stock
Don't leave your profits to chance. Historically, this stock follows specific seasonal patterns that institutional traders use to maximize returns.
- ✅ Identify the "Golden Buying Window"
- ✅ Avoid high-risk correction cycles
- ✅ Backtested data from the last 20+ years