
July 04, 2026 a 04:28 am
USDCHF: Trend and Support & Resistance Analysis
The USDCHF pair has shown fluctuating trends in recent months, reflecting broader economic conditions and investor sentiment. Technical analysis of USDCHF offers insights into potential future movements and market behavior. Recent data suggests potential shifts in trend, with critical support and resistance levels becoming increasingly important. Close monitoring of economic indicators and global events can help anticipate future price action. Understanding these movements is crucial for informed trading and risk management.
Trend Analysis
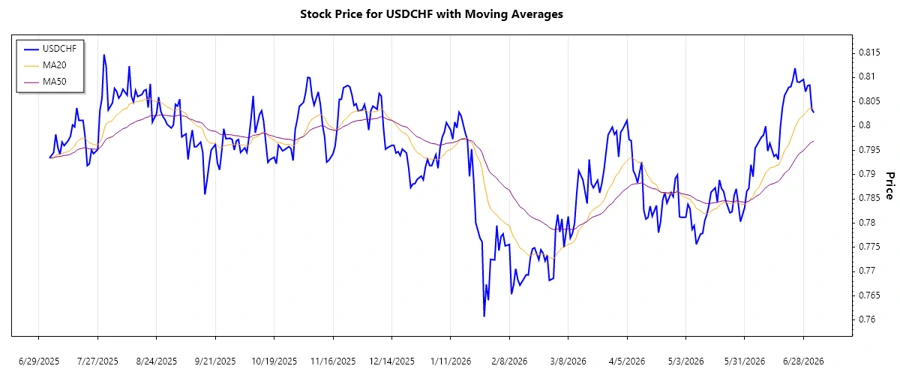
Recent analysis of USDCHF closing prices shows a well-defined trend over the past few months. The Exponential Moving Average (EMA) calculations reveal:
| Date | Closing Price | Trend |
|---|---|---|
| 2026-07-03 | 0.80276 | ▼ |
| 2026-07-02 | 0.80341 | ▲ |
| 2026-07-01 | 0.80845 | ▲ |
| 2026-06-30 | 0.80833 | ▲ |
| 2026-06-29 | 0.80708 | ⚖️ |
| 2026-06-28 | 0.8096 | ▲ |
| 2026-06-26 | 0.80901 | ⚖️ |
Based on recent EMA20 and EMA50 values, the USDCHF is in a strong uptrend, characterized by higher highs and higher lows. This technical indicator suggests bullish momentum, likely continuing unless key support levels are breached.
Support and Resistance
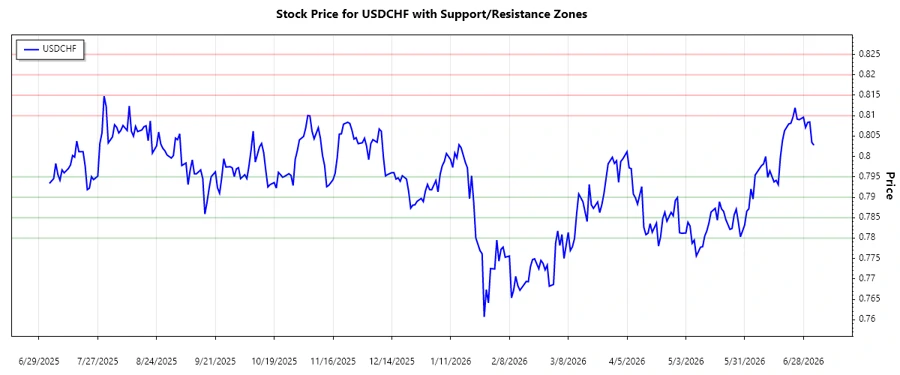
Support and resistance zones for USDCHF reveal significant levels where the price action has historically been contained:
| Zone Type | From | To |
|---|---|---|
| Support Zone 1 | 0.7800 | 0.7850 |
| Support Zone 2 | 0.7900 | 0.7950 |
| Resistance Zone 1 | 0.8100 | 0.8150 |
| Resistance Zone 2 | 0.8200 | 0.8250 |
The current price level is within the first resistance zone, suggesting potential for a reversal or breakout. As USDCHF trades near these major levels, volatility could increase, leading to rapid movements.
Conclusion
The recent USDCHF analysis highlights an ongoing bullish trend, evident from the crossover of the EMA20 above EMA50. While support zones provide a safety net for potential downturns, the approaching resistance levels could challenge further upward momentum. Traders should watch these zones closely as indicators of potential price reversals or breakouts. The USDCHF's performance will likely be influenced by economic conditions, making risk management and technical analysis crucial for any trading strategy. As the market evolves, staying informed through continuous monitoring will be key to navigating price changes effectively.
Smart Data Insight
Master the Perfect Entry & Exit for this Stock
Don't leave your profits to chance. Historically, this stock follows specific seasonal patterns that institutional traders use to maximize returns.
- ✅ Identify the "Golden Buying Window"
- ✅ Avoid high-risk correction cycles
- ✅ Backtested data from the last 20+ years