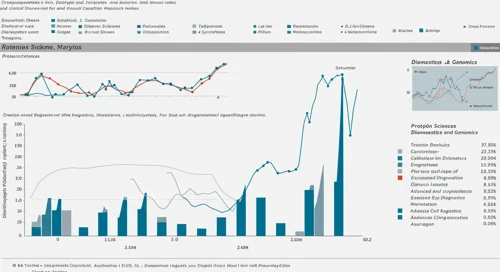
Utilities Comparison. 10 Mar

Comparison of Utilities. Where is strength and weakness? What has developed well and badly?
March 10, 2026 a 03:17 pm
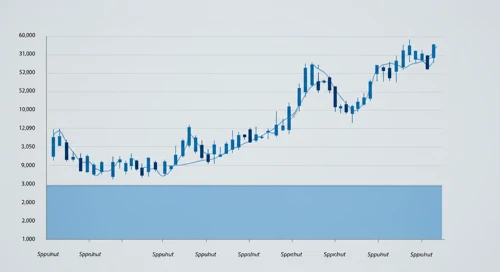
WRB: Fibunacci Level Technical Analysis - W R Berkley Corporation

WRB: Fibonacci retracement levels to identify key potential support and resistance zones, based on recent price trends.
March 10, 2026 a 03:15 pm
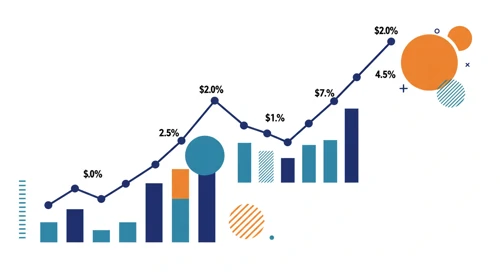
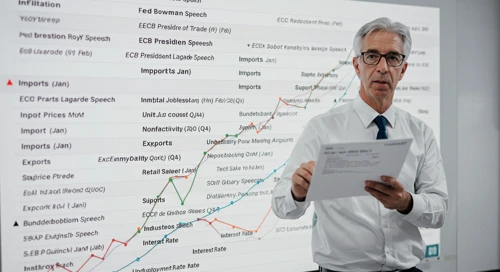
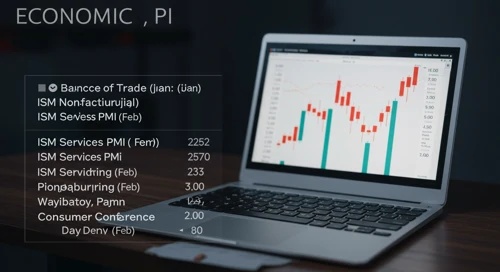
Todays Important Key Figures 10 Mar
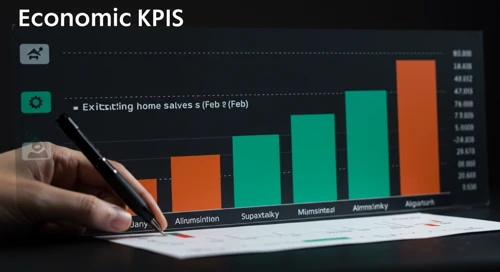
Today’s important economic data releases – a snapshot of key indicators influencing markets and shaping financial expectations.
March 10, 2026 a 03:00 pm
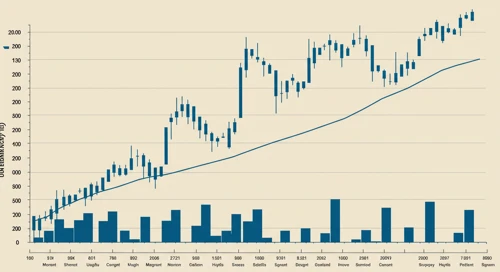
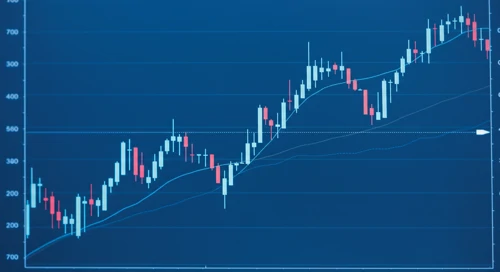
TPL: Trend with Support and Resistance Levels - Texas Pacific Land Corporation
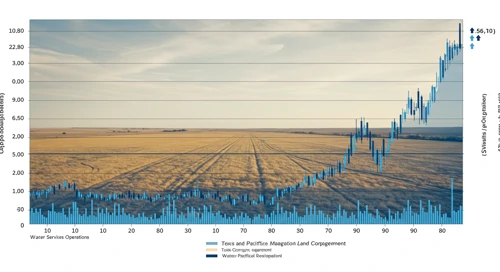
TPL: Current price trend is evaluated alongside key support and resistance level. View of potential turning points and price momentum.
March 10, 2026 a 02:03 pm
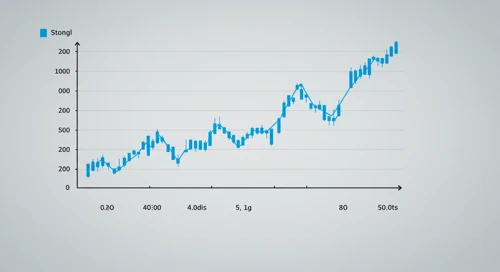
MMC: Trend with Support and Resistance Levels - Marsh and McLennan Companies Inc

MMC: Current price trend is evaluated alongside key support and resistance level. View of potential turning points and price momentum.
March 10, 2026 a 01:15 pm
REG: Fundamental Ratio Analysis - Regency Centers Corporation
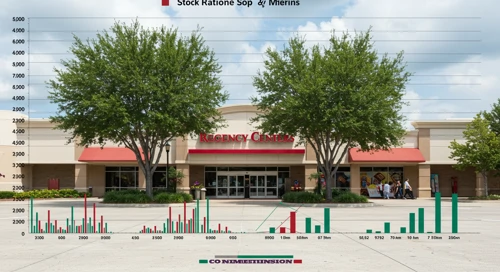
REG: Evaluation of key financial ratios, analyst ratings, and price targets. A data-driven perspective on the valuation and market expectations.
March 10, 2026 a 01:00 pm
FFIV: Analysts Ratings - F5 Inc

FFIV: Comprehensive breakdown of current and historical analyst ratings, offering insights into how expert sentiment has evolved over time.
March 10, 2026 a 01:00 pm
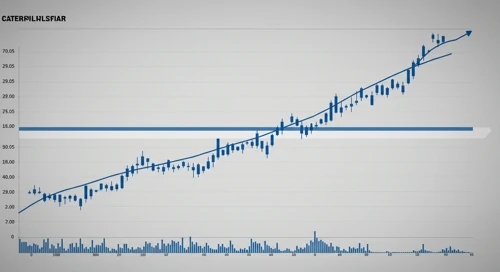
CAT: Fibunacci Level Technical Analysis - Caterpillar Inc
March 10, 2026 a 04:44 pm

DPZ: Analysts Ratings - Dominos Pizza Inc
March 10, 2026 a 04:38 pm
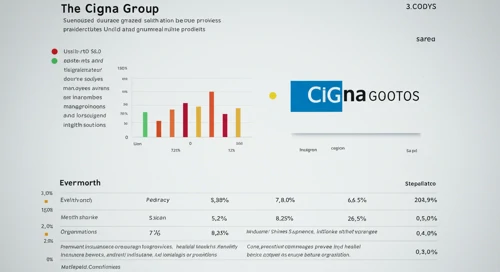
CI: Fundamental Ratio Analysis - Cigna Corporation
March 10, 2026 a 03:43 pm

SHW: Dividend Analysis - The Sherwin Williams Company
March 10, 2026 a 03:31 pm
EMR: Dividend Analysis - Emerson Electric Co

EMR: In-depth analysis of a company's dividend stability and key fundamental ratios to assess its financial strength and long-term investment potential.
March 10, 2026 a 12:47 pm
SYY: Analysts Ratings - Sysco Corporation

SYY: Comprehensive breakdown of current and historical analyst ratings, offering insights into how expert sentiment has evolved over time.
March 10, 2026 a 12:38 pm
Commodities Comparison. 10 Mar

Comparison of Commodities. Where is strength and weakness? What has developed well and badly?
March 10, 2026 a 12:31 pm
NWS: Fibunacci Level Technical Analysis - News Corporation
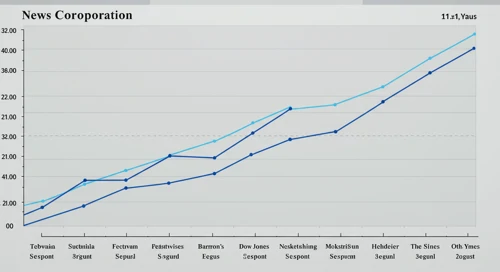
NWS: Fibonacci retracement levels to identify key potential support and resistance zones, based on recent price trends.
March 10, 2026 a 11:44 am
TMO: Fundamental Ratio Analysis - Thermo Fisher Scientific Inc
TMO: Evaluation of key financial ratios, analyst ratings, and price targets. A data-driven perspective on the valuation and market expectations.
March 10, 2026 a 11:43 am
BRO: Dividend Analysis - Brown and Brown Inc

BRO: In-depth analysis of a company's dividend stability and key fundamental ratios to assess its financial strength and long-term investment potential.
March 10, 2026 a 11:31 am
KR: Fibunacci Level Technical Analysis - The Kroger Co
KR: Fibonacci retracement levels to identify key potential support and resistance zones, based on recent price trends.
March 10, 2026 a 10:15 am
Stock Market - Heatmap
Use mouse wheel to zoom in and out. Click a ticker to display detailed information in a new window. Hover mouse cursor over a ticker to see more data.
Stock's
NOC: Dividend Analysis - Northrop Grumman Corporation

NOC: In-depth analysis of a company's dividend stability and key fundamental ratios to assess its financial strength and long-term investment potential.
March 10, 2026 a 07:46 am
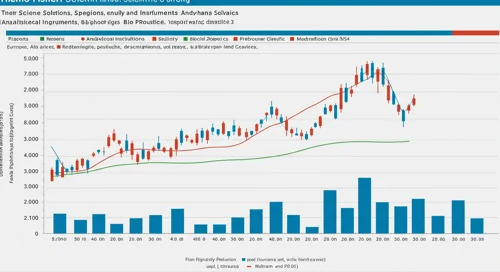
TECH: Fundamental Ratio Analysis - Bio Techne Corporation
TECH: Evaluation of key financial ratios, analyst ratings, and price targets. A data-driven perspective on the valuation and market expectations.
March 10, 2026 a 07:43 am
NKE: Fibunacci Level Technical Analysis - NIKE Inc
NKE: Fibonacci retracement levels to identify key potential support and resistance zones, based on recent price trends.
March 10, 2026 a 06:44 am
MRK: Fibunacci Level Technical Analysis - Merck and Co Inc
MRK: Fibonacci retracement levels to identify key potential support and resistance zones, based on recent price trends.
March 10, 2026 a 05:15 am
CNP: Trend with Support and Resistance Levels - CenterPoint Energy Inc
CNP: Current price trend is evaluated alongside key support and resistance level. View of potential turning points and price momentum.
March 10, 2026 a 04:03 am
UNP: Dividend Analysis - Union Pacific Corporation

UNP: In-depth analysis of a company's dividend stability and key fundamental ratios to assess its financial strength and long-term investment potential.
March 10, 2026 a 03:31 am
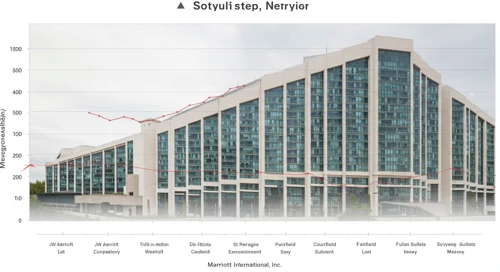
MAR: Trend with Support and Resistance Levels - Marriott International Inc
MAR: Current price trend is evaluated alongside key support and resistance level. View of potential turning points and price momentum.
March 10, 2026 a 03:15 am
MAR: Analysts Ratings - Marriott International Inc
March 10, 2026 a 09:00 am
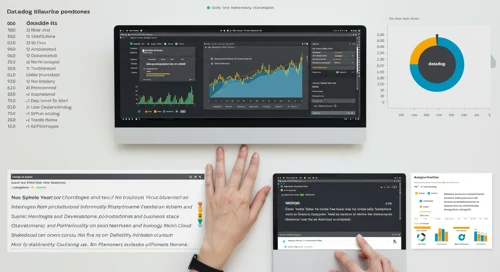
DDOG: Analysts Ratings - Datadog Inc
March 10, 2026 a 08:38 am
ZBH: Trend with Support and Resistance Levels - Zimmer Biomet Holdings Inc
March 10, 2026 a 08:15 am

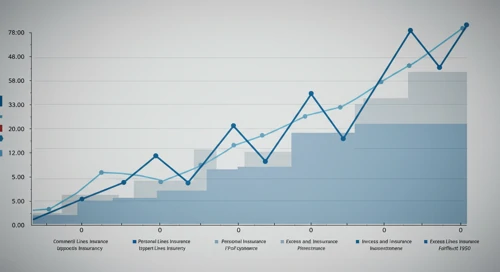
SPG: Fundamental Ratio Analysis - Simon Property Group Inc
March 10, 2026 a 08:00 am
XOM: Analysts Ratings - Exxon Mobil Corporation
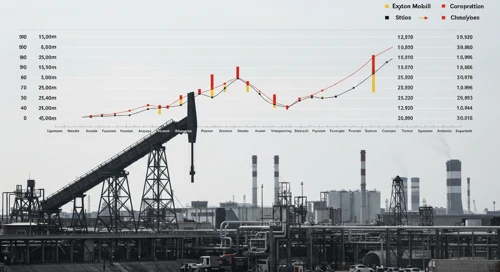
XOM: Comprehensive breakdown of current and historical analyst ratings, offering insights into how expert sentiment has evolved over time.
March 09, 2026 a 09:00 pm
EPAM: Analysts Ratings - EPAM Systems Inc

EPAM: Comprehensive breakdown of current and historical analyst ratings, offering insights into how expert sentiment has evolved over time.
March 09, 2026 a 08:38 pm
PSA: Fundamental Ratio Analysis - Public Storage

PSA: Evaluation of key financial ratios, analyst ratings, and price targets. A data-driven perspective on the valuation and market expectations.
March 09, 2026 a 07:43 pm
HOOD: Fundamental Ratio Analysis - Robinhood Markets Inc
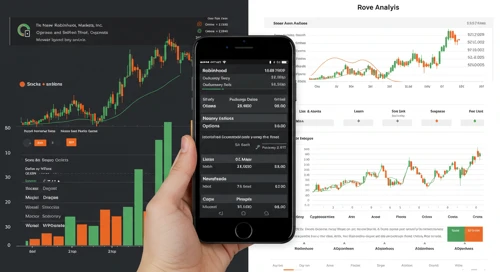
HOOD: Evaluation of key financial ratios, analyst ratings, and price targets. A data-driven perspective on the valuation and market expectations.
March 09, 2026 a 06:00 pm
CTRA: Analysts Ratings - Coterra Energy Inc
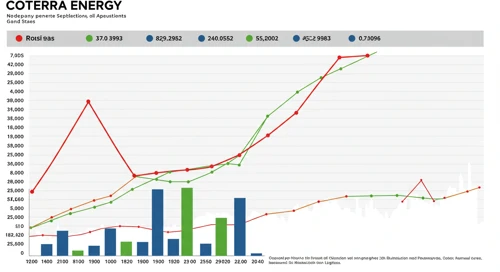
CTRA: Comprehensive breakdown of current and historical analyst ratings, offering insights into how expert sentiment has evolved over time.
March 09, 2026 a 05:00 pm
CINF: Fibunacci Level Technical Analysis - Cincinnati Financial Corporation
CINF: Fibonacci retracement levels to identify key potential support and resistance zones, based on recent price trends.
March 09, 2026 a 04:45 pm
STE: Analysts Ratings - STERIS plc
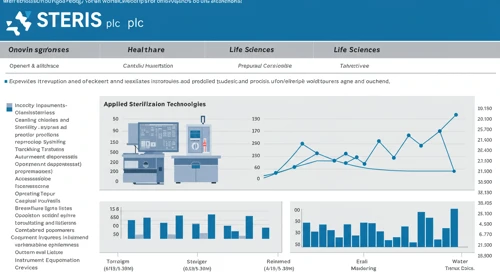
STE: Comprehensive breakdown of current and historical analyst ratings, offering insights into how expert sentiment has evolved over time.
March 09, 2026 a 04:38 pm
Economic Calendar
Currencies
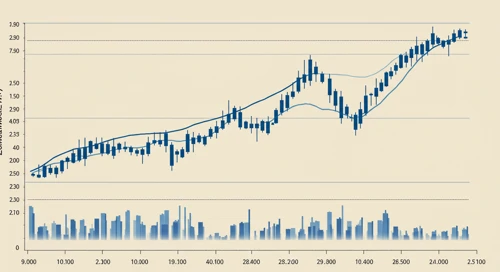
NZDJPY: Fibunacci Level Technical Analysis
NZDJPY: Fibonacci retracement levels to identify key potential support and resistance zones, based on recent price trends.
March 09, 2026 a 05:08 am
USDCHF: Trend with Support and Resistance Levels
USDCHF: Current price trend is evaluated alongside key support and resistance level. View of potential turning points and price momentum.
March 09, 2026 a 04:28 am
GBPCAD: Fibunacci Level Technical Analysis
GBPCAD: Fibonacci retracement levels to identify key potential support and resistance zones, based on recent price trends.
March 08, 2026 a 05:08 am
GBPAUD: Fibunacci Level Technical Analysis
GBPAUD: Fibonacci retracement levels to identify key potential support and resistance zones, based on recent price trends.
March 07, 2026 a 05:08 am
NZDCHF: Trend with Support and Resistance Levels
NZDCHF: Current price trend is evaluated alongside key support and resistance level. View of potential turning points and price momentum.
March 07, 2026 a 04:28 am
Todays Important Key Figures 07 Mar
Today’s important economic data releases – a snapshot of key indicators influencing markets and shaping financial expectations.
March 06, 2026 a 11:00 pm
Todays Important Key Figures 06 Mar

Today’s important economic data releases – a snapshot of key indicators influencing markets and shaping financial expectations.
March 06, 2026 a 07:00 pm
CADJPY: Fibunacci Level Technical Analysis
March 10, 2026 a 05:08 am
EURCHF: Trend with Support and Resistance Levels
March 10, 2026 a 04:28 am

Important Key Figures of the last Days
March 10, 2026 a 02:31 am
Todays Important Key Figures 09 Mar
March 09, 2026 a 07:00 pm
EURGBP: Fibunacci Level Technical Analysis
EURGBP: Fibonacci retracement levels to identify key potential support and resistance zones, based on recent price trends.
March 06, 2026 a 05:08 am
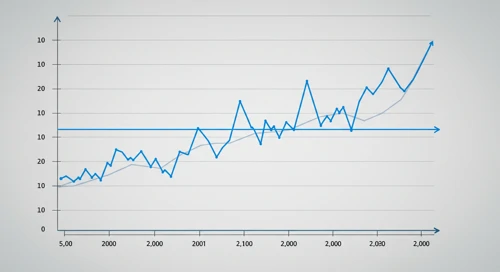
EURUSD: Trend with Support and Resistance Levels
EURUSD: Current price trend is evaluated alongside key support and resistance level. View of potential turning points and price momentum.
March 06, 2026 a 04:28 am
Todays Important Key Figures 05 Mar
Today’s important economic data releases – a snapshot of key indicators influencing markets and shaping financial expectations.
March 05, 2026 a 07:00 pm
USDJPY: Fibunacci Level Technical Analysis
USDJPY: Fibonacci retracement levels to identify key potential support and resistance zones, based on recent price trends.
March 05, 2026 a 05:08 am
AUDUSD: Trend with Support and Resistance Levels
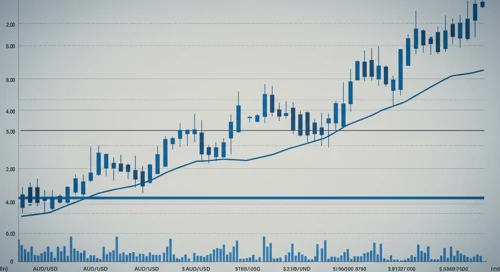
AUDUSD: Current price trend is evaluated alongside key support and resistance level. View of potential turning points and price momentum.
March 05, 2026 a 04:28 am
Important Key Figures of the last Days

Overview of key economic indicators released over the past days, highlighting their potential impact on markets and investor sentiment.
March 05, 2026 a 02:31 am
Todays Important Key Figures 04 Mar
Today’s important economic data releases – a snapshot of key indicators influencing markets and shaping financial expectations.
March 04, 2026 a 07:00 pm
Currencies