
March 10, 2026 a 12:47 pm


EMR: Dividend Analysis - Emerson Electric Co.
Emerson Electric Co. demonstrates a resilient dividend profile with over half a century of continued payouts. The company's inherent stability in its sector, combined with a moderate dividend yield and a solid history of annual increases, positions it as a potential focal point for income-focused investors. However, the modest growth in dividends over recent years suggests that returns may not accelerate rapidly. Investors should weigh these factors in conjunction with its payout commitment for a comprehensive evaluation.
📊 Overview
Emerson Electric Co. has established itself as a steadfast dividend payer in the Industrials sector. Its current yield, while modest, is bolstered by a remarkable consistency in dividend history, spanning over five decades without interruption. This commitment speaks volumes about the company's financial strategy and its shareholder focus.
| Metric | Value |
|---|---|
| Sector | Industrials |
| Dividend yield | 1.46 % |
| Current dividend per share | 2.10 USD |
| Dividend history | 55 years |
| Last cut or suspension | None |
🗣️ Dividend History
The historical consistency of Emerson's dividend payments underscores its robust financial health and commitment to returning value to shareholders. With no record of cuts or suspensions, investors are provided with reliability—a key factor in long-term income planning.
| Year | Dividend Per Share (USD) |
|---|---|
| 2025 | 2.13 |
| 2024 | 2.10 |
| 2023 | 2.09 |
| 2022 | 2.07 |
| 2021 | 2.03 |
📈 Dividend Growth
Emerson's dividend growth rates indicate a modest yet steady upward trend, reflective of prudent fiscal management and gradual reinvestment in core operational capacities. This growth trajectory is indicative of stable expansionary policies that benefit long-term investors wishing for stable income increments.
| Time | Growth |
|---|---|
| 3 years | 1.16 % |
| 5 years | 1.29 % |
The average dividend growth is 1.29% over 5 years. This shows moderate but steady dividend growth.
✅ Payout Ratio
Emerson's payout ratios offer insights into its profit distribution efficiency and potential sustainability of its dividend policies. With a prudent payout ratio, the company ensures that its dividend commitments are matched with earning capabilities, reducing the risk of inconsistencies.
| Key figure | Ratio |
|---|---|
| EPS-based | 51.09 % |
| Free cash flow-based | 45.93 % |
Both EPS and FCF payout ratios are within reasonable ranges, suggesting that Emerson retains satisfactory reserves for both capital expenditures and future dividend stability.
Cashflow & Capital Efficiency
Analyzing Emerson’s cash flows reflects a solid foundation in generating free cash flows, critical in maintaining liquidity for dividend payouts without impairing growth potential. Efficiency in capital allocation further accentuates its capability for economic value creation.
| Metric | 2025 | 2024 | 2023 |
|---|---|---|---|
| Free Cash Flow Yield | 3.59 % | 4.66 % | 0.49 % |
| Earnings Yield | 3.08 % | 3.15 % | 23.84 % |
| CAPEX to Operating Cash Flow | 13.91 % | 12.58 % | 56.99 % |
| Stock-based Compensation to Revenue | 1.46 % | 1.49 % | 1.65 % |
| Free Cash Flow / Operating Cash Flow Ratio | 86.09 % | 87.42 % | 43.01 % |
The stability in cash flows and efficient capital use signifies a robust operational framework that is not only conducive to upholding dividend obligations but also supportive of strategic reinvestments.
Balance Sheet & Leverage Analysis
The balance sheet metrics unveil Emerson’s modest leverage levels and strong solvency, essential in maintaining financial prudence. These ratios reveal the organization’s capacity to service debt responsibly while also bolstering shareholder equity.
| Metric | 2025 | 2024 | 2023 |
|---|---|---|---|
| Debt-to-Equity | 67.84 % | 38.62 % | 41.38 % |
| Debt-to-Assets | 32.79 % | 18.89 % | 20.03 % |
| Debt-to-Capital | 40.42 % | 27.86 % | 29.27 % |
| Net Debt to EBITDA | 2.51 | 1.18 | 0.12 |
| Current Ratio | 0.88 | 1.77 | 2.75 |
| Quick Ratio | 0.65 | 1.40 | 2.35 |
| Financial Leverage | 2.07 | 2.05 | 2.06 |
These figures emphasize a solid financial foundation with ample liquidity and controlled leverage, thereby supporting Emerson’s growth initiatives and sustaining its financial commitments.
Fundamental Strength & Profitability
Key profitability and return metrics underscore Emerson’s operational efficacy. High return ratios reflect effective use of shareholder funds, aiding in fortifying long-term financial health and value generation.
| Metric | 2025 | 2024 | 2023 |
|---|---|---|---|
| Return on Equity | 11.31 % | 9.10 % | 63.89 % |
| Return on Assets | 5.46 % | 4.45 % | 30.92 % |
| Margins: Net | 12.73 % | 11.25 % | 87.17 % |
| Margins: EBIT | 17.60 % | 13.39 % | 20.86 % |
| Margins: EBITDA | 26.98 % | 23.05 % | 27.79 % |
| Margins: Gross | 52.84 % | 50.79 % | 48.97 % |
| R&D to Revenue | 0.00 % | 0.00 % | 0.00 % |
The high profitability levels and consistent returns on equity and assets indicate efficient management and lucrative business operations, which justify Emerson’s esteemed position in its industry.
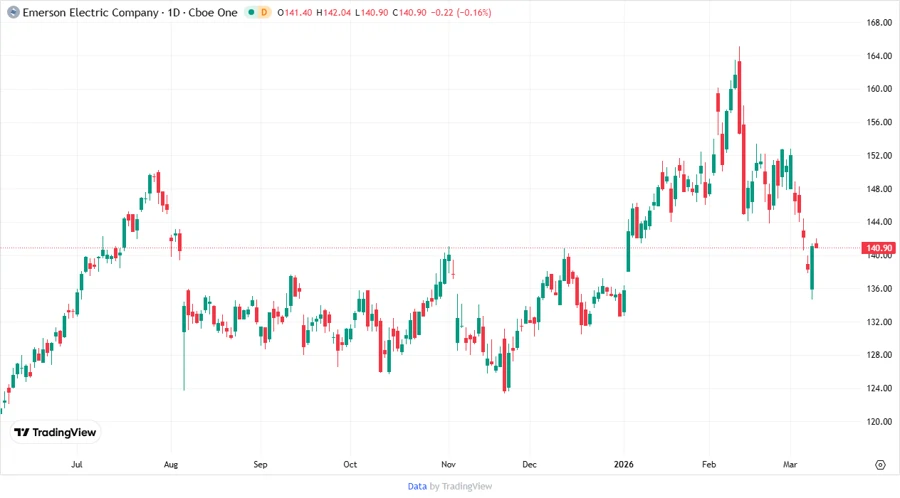
Price Development
🧮 Dividend Scoring System
| Category | Score | Score Bar |
|---|---|---|
| Dividend yield | 3 | |
| Dividend Stability | 5 | |
| Dividend growth | 3 | |
| Payout ratio | 4 | |
| Financial stability | 4 | |
| Dividend continuity | 5 | |
| Cashflow Coverage | 4 | |
| Balance Sheet Quality | 5 |
Total Score: 33/40
📝 Rating
Emerson Electric Co. stands out as a reliable dividend payer grounded in fiscal prudence and sustainability. Despite modest growth projections, its financial robustness and over five decades of dividend consistency render it an attractive option for income-driven portfolios. As such, Emerson is recommended for investors seeking reliable dividend income with moderate growth potential.
Smart Data Insight
Master the Perfect Entry & Exit for this Stock
Don't leave your profits to chance. Historically, this stock follows specific seasonal patterns that institutional traders use to maximize returns.
- ✅ Identify the "Golden Buying Window"
- ✅ Avoid high-risk correction cycles
- ✅ Backtested data from the last 20+ years