March 10, 2026 a 08:15 am


ZBH: Trend and Support & Resistance Analysis - Zimmer Biomet Holdings, Inc.
Zimmer Biomet Holdings, Inc. has shown considerable resilience in the musculoskeletal healthcare market. Despite challenges, the company has maintained a steady growth trajectory, supported by a strong product portfolio. The recent trend analysis indicates a potential upward momentum, but there are also signs of volatility. Investors should consider both technical and fundamental aspects when evaluating this stock.
Trend Analysis
| Date | Closing Price | Trend |
|---|---|---|
| 2026-03-09 | 93.28 | ▼ |
| 2026-03-06 | 94.11 | ▲ |
| 2026-03-05 | 93.45 | ▲ |
| 2026-03-04 | 95.75 | ▲ |
| 2026-03-03 | 97.97 | ▲ |
| 2026-03-02 | 99.49 | ▲ |
| 2026-02-27 | 98.44 | ▲ |
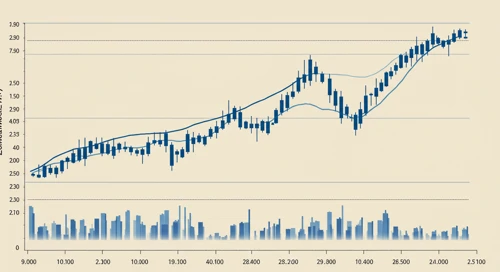
The recent trend indicates a bullish momentum with the EMA20 crossing above the EMA50, suggesting a potential upward trend continuation. This technical setup is often considered a buy signal by traders.
Support and Resistance
| Zone | Start | End |
|---|---|---|
| Support Zone 1 | 91.00 | 92.00 |
| Support Zone 2 | 88.00 | 89.00 |
| Resistance Zone 1 | 99.00 | 100.00 |
| Resistance Zone 2 | 102.00 | 103.00 |
The current price is approaching the first resistance zone of 99.00-100.00. A breakthrough above this level could signal further bullish opportunities. However, traders should watch for potential reversals.
Conclusion
The trend analysis of Zimmer Biomet Holdings suggests ongoing upward momentum, reflected by recent price movements and EMAs. However, the proximity to resistance levels calls for careful monitoring as the stock approaches critical price zones. The stock presents opportunities for gains if the upward trend holds, but vigilance is advised due to potential market volatilities. Investors should align their strategies with both technical indicators and current market conditions.