March 10, 2026 a 03:43 pm
CI: Fundamental Ratio Analysis - Cigna Corporation
Cigna Corporation (CI) operates in the US insurance market, offering a wide range of health services through its Evernorth and Cigna Healthcare segments. With robust solutions for pharmacy and benefits management, the company caters to diverse customer needs from health plans to multinational organizations. The stock has shown consistent performance, making it an attractive candidate for long-term investment.
Fundamental Rating
Cigna Corporation boasts strong fundamentals, indicated by an impressive overall score. The rating reflects its ability to manage cash flows and equity returns effectively.
| Category | Score | Visualization |
|---|---|---|
| Discounted Cash Flow | 5 | |
| Return on Equity | 4 | |
| Return on Assets | 4 | |
| Debt to Equity | 1 | |
| Price to Earnings | 3 | |
| Price to Book | 3 |
Historical Rating
The historical ratings provide insight into the company's performance over time, underpinning its reliability and operational efficiency.
| Date | Overall Score | DCF | ROE | ROA | Debt to Equity | P/E | P/B |
|---|---|---|---|---|---|---|---|
| 2026-03-10 | 4 | 5 | 4 | 4 | 1 | 3 | 3 |
| Previous | 0 | 5 | 4 | 4 | 1 | 3 | 3 |
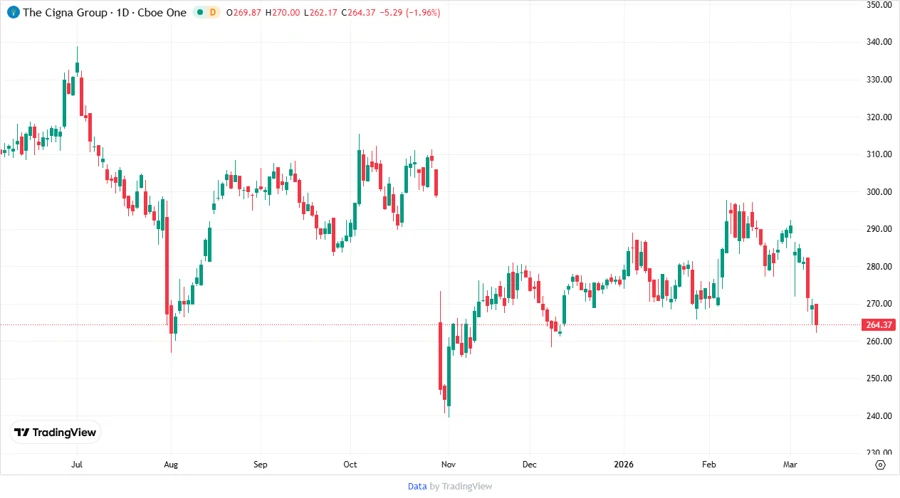
Analyst Price Targets
Analyst estimates indicate strong upside potential in Cigna's share price, with significant positive consensus.
| High | Low | Median | Consensus |
|---|---|---|---|
| 375 | 300 | 321.5 | 325.83 |
Analyst Sentiment
Cigna Corporation reflects a solid buy recommendation, underpinned by robust buy strength.
| Recommendation | Count | Distribution |
|---|---|---|
| Strong Buy | 1 | |
| Buy | 30 | |
| Hold | 8 | |
| Sell | 0 | |
| Strong Sell | 0 |
Conclusion
Cigna Corporation is a financially sound company with robust returns and a great track record. It is well-positioned in the healthcare sector, offering diversified services. Analyst ratings and price targets are optimistic, reflecting strong buy sentiment. However, potential investors should consider market conditions and future regulatory impacts. Overall, Cigna provides a favorable risk-reward balance for investors seeking exposure to the healthcare insurance space.
Smart Data Insight
Master the Perfect Entry & Exit for this Stock
Don't leave your profits to chance. Historically, this stock follows specific seasonal patterns that institutional traders use to maximize returns.
- ✅ Identify the "Golden Buying Window"
- ✅ Avoid high-risk correction cycles
- ✅ Backtested data from the last 20+ years