March 10, 2026 a 11:44 am

NWS: Fibonacci Analysis - News Corporation
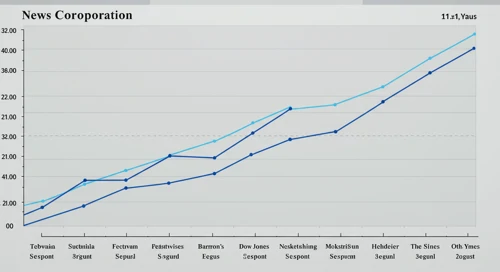
News Corporation, a leading media and information services company, shows a notable trend in its stock performance. The recent data reflects a downward trend after a peak in early September 2025. This analysis explores Fibonacci retracement levels to better understand potential price reversals and market behavior. Investors should watch for key support and resistance levels indicated by the Fibonacci levels.
Fibonacci Analysis
| Analysis Detail | Value |
|---|---|
| Trend Start Date | 2025-09-30 |
| Trend End Date | 2026-03-09 |
| High Price (Date) | $34.55 (2025-09-30) |
| Low Price (Date) | $26.22 (2026-03-03) |
| Current Price | $27.71 |
Fibonacci Levels
| Retracement Level | Price |
|---|---|
| 23.6% | $28.97 |
| 38.2% | $30.08 |
| 50% | $30.39 |
| 61.8% | $30.85 |
| 78.6% | $31.44 |
Currently, the price is within the 23.6% retracement level, which may act as initial resistance. If the price breaks above this level, it could target higher Fibonacci points as potential resistance zones.
Technical interpretation suggests that the 23.6% level is serving as a resistance. A break above could indicate a reversal or continuation back towards the higher retracement levels.
Conclusion
The News Corporation stock has recently exhibited a downward trend, with potential support around the $26.22 low. The observed Fibonacci levels are crucial in determining upcoming support and resistance. If the stock price can break through the 23.6% level, it suggests potential for recovery or reversal patterns. However, should the price fail to exceed this level, further declines might occur, reaffirming the downward trend. Investors should remain observant of these technical signals and market developments.