November 23, 2025 a 08:15 am
ZTS: Trend and Support & Resistance Analysis - Zoetis Inc.
Zoetis Inc., a leading company in animal health, has shown variability in its stock movements over recent months. With its core market focusing on vaccines and medicines for livestock and companion animals, it remains a promising entity within its industry. Recent trends indicate varying degrees of market sentiment and price fluctuations, reflecting both internal company developments and broader market conditions. This analysis will focus on understanding current trends and pinpointing significant areas of support and resistance for ZTS stock.
Trend Analysis
| Date | Close Price | Trend |
|---|---|---|
| 2025-11-21 | 122.06 | ▼ |
| 2025-11-20 | 115.89 | ▼ |
| 2025-11-19 | 117.08 | ▲ |
| 2025-11-18 | 118.14 | ▲ |
| 2025-11-17 | 118.80 | ▲ |
| 2025-11-14 | 120.82 | ▲ |
| 2025-11-13 | 121.16 | ▲ |
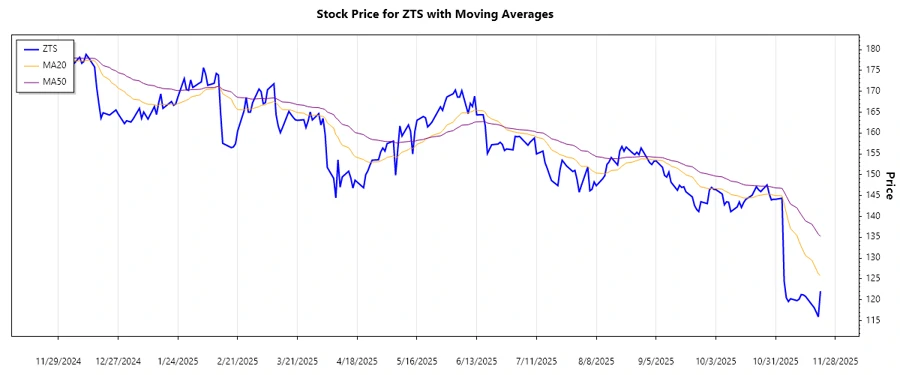
In the recent week, the stock has undergone significant volatility with the EMA20 being less than the EMA50, indicating a general downside trend. Despite some up days, the overall trend suggests caution as the stock has been predominantly downward.
Support and Resistance
| Zone Type | From | To |
|---|---|---|
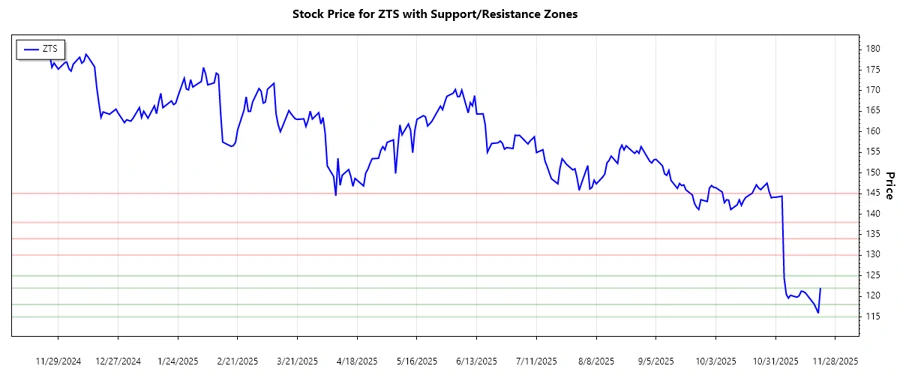
| Support | 115.00 | 118.00 |
| Support | 122.00 | 125.00 |
| Resistance | 130.00 | 134.00 |
| Resistance | 138.00 | 145.00 |
Currently, the stock is navigating between the support zone of 115.00 to 118.00. This suggests potential stability, though caution is advised due to the above resistance zones that may influence selling pressure.
Conclusion
Zoetis Inc.'s current technical setup indicates a predominantly bearish trend despite recent attempts at recovery. Support zones may provide some stability, but the stock faces significant resistance levels. Investors should remain cautious given the overall market volatility. Long-term prospects remain largely tied to the company's fundamental strengths, but short-term movements may be dictated by technical barriers and broader market sentiments. Monitoring these technical levels will be crucial for informed trading decisions.
Smart Data Insight
Master the Perfect Entry & Exit for this Stock
Don't leave your profits to chance. Historically, this stock follows specific seasonal patterns that institutional traders use to maximize returns.
- ✅ Identify the "Golden Buying Window"
- ✅ Avoid high-risk correction cycles
- ✅ Backtested data from the last 20+ years