
June 17, 2026 a 03:30 pm

ZTS: Dividend Analysis - Zoetis Inc.
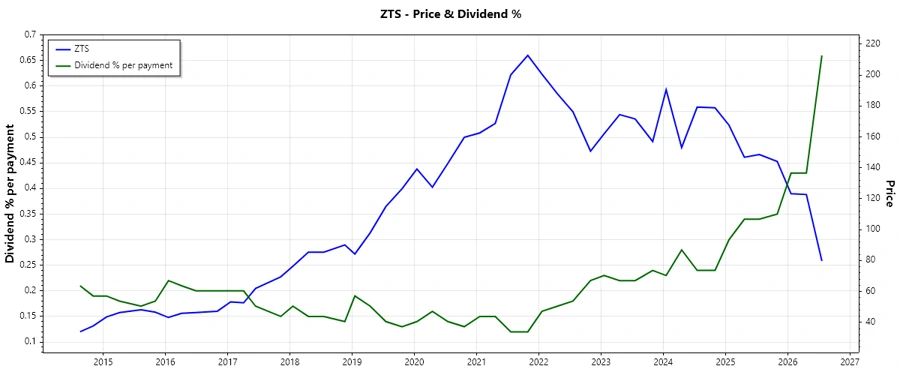
Zoetis Inc., a leading company in the animal health sector, showcases a promising dividend profile with steady growth, making it an attractive option for dividend investors. The company's resilience in maintaining dividends over the years underscores its robust financial health. However, careful consideration of payout ratios and growth projections is essential to evaluate its suitability for long-term investment.
📊 Overview
The following table provides crucial insights into Zoetis Inc.'s dividend metrics across various parameters:
| Parameter | Value |
|---|---|
| Sector | Animal Health |
| Dividend yield | 2.64 % |
| Current dividend per share | 2.00 USD |
| Dividend history | 14 years |
| Last cut or suspension | None |
🗣️ Dividend History
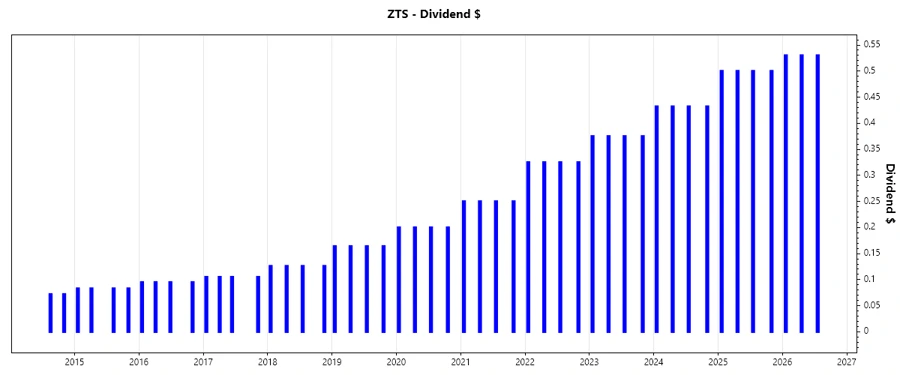
Analyzing the dividend history of Zoetis Inc. reveals consistency and stability, essential factors for assessing the reliability of income streams for investors.
| Year | Dividend per Share (USD) |
|---|---|
| 2026 | 1.59 |
| 2025 | 2.00 |
| 2024 | 1.728 |
| 2023 | 1.500 |
| 2022 | 1.300 |
📈 Dividend Growth
Growth in dividends highlights the company’s capacity to enhance payouts, essential for long-term income-focused investors.
| Time | Growth |
|---|---|
| 3 years | 15.44 % |
| 5 years | 20.11 % |
The average dividend growth is 20.11 % over 5 years. This shows moderate but steady dividend growth.
✅ Payout Ratio
Payout ratios offer insight into a company’s ability to sustain its dividend payouts without compromising financial flexibility.
| Key figure | Ratio |
|---|---|
| EPS-based | 32.02 % |
| Free cash flow-based | 39.35 % |
The EPS-based payout ratio at 32.02 % and FCF-based ratio at 39.35 % suggest a sustainable dividend policy, indicating financial prudence.
📉 Cashflow & Capital Efficiency
Cash flow metrics and capital efficiency ratios highlight Zoetis Inc.'s operational effectiveness and capacity for investment into growth areas.
| Metric | 2025 | 2024 | 2023 |
|---|---|---|---|
| Free Cash Flow Yield | 4.09 % | 3.11 % | 1.78 % |
| Earnings Yield | 4.79% | 3.36% | 2.57% |
| CAPEX to Operating Cash Flow | 21.41% | 22.18% | 31.11% |
| Stock-based Compensation to Revenue | 0.88% | 0.77% | 0.70% |
| Free Cash Flow / Operating Cash Flow Ratio | 78.62% | 77.82% | 68.89% |
The data indicates a stable cash flow, signifying confident capital allocation strategies facilitating business growth and shareholder value.
⚠️ Balance Sheet & Leverage Analysis
A robust balance sheet is crucial for ensuring a company's resilience in financial downturns, while leverage metrics indicate potential financial risk.
| Metric | 2025 | 2024 | 2023 |
|---|---|---|---|
| Debt-to-Equity | 284.99% | 141.38% | 135.18% |
| Debt-to-Assets | 61.38% | 47.37% | 47.28% |
| Debt-to-Capital | 74.03% | 58.57% | 57.48% |
| Net Debt to EBITDA | 1.76 | 1.23 | 1.28 |
| Current Ratio | 3.15 | 0 | 3.36 |
| Quick Ratio | 1.94 | 1.08 | 2.00 |
| Financial Leverage | 4.64 | 2.98 | 2.86 |
The leverage ratios call for attention due to high debt levels, but liquidity ratios indicate sound short-term financial health.
🗣️ Fundamental Strength & Profitability
Profitability and efficiency metrics provide insights into Zoetis’ operational excellence and long-term growth potential.
| Metric | 2025 | 2024 | 2023 |
|---|---|---|---|
| Return on Equity | 80.25% | 52.11% | 46.91% |
| Return on Assets | 17.28% | 17.46% | 16.41% |
| Margins: Net | 28.23% | 26.86% | 27.43% |
| EBIT | 37.84% | 36.46% | 37.38% |
| EBITDA | 42.98% | 41.83% | 43.13% |
| Gross | 70.49% | 69.10% | 68.28% |
| Research & Development to Revenue | 7.38% | 7.41% | 7.18% |
High return on equity and consistent margins underscore Zoetis Inc.’s effective management and competitive advantage within the sector.
📈 Price Development
🌟 Dividend Scoring System
| Criteria | Score | Score Bar |
|---|---|---|
| Dividend yield | 4 | |
| Dividend Stability | 5 | |
| Dividend Growth | 4 | |
| Payout Ratio | 4 | |
| Financial Stability | 3 | |
| Dividend Continuity | 5 | |
| Cashflow Coverage | 4 | |
| Balance Sheet Quality | 3 |
Overall Score: 32/40
📝 Rating
Zoetis Inc. demonstrates a commendable dividend profile characterized by solid growth and stability. The prudent payout ratio and consistent dividend history make it a favorable choice among dividend-focused investors. However, the high leverage requires careful monitoring. Overall, Zoetis Inc. is a viable option for those seeking reliable dividend income with moderate growth potential.
Smart Data Insight
Master the Perfect Entry & Exit for this Stock
Don't leave your profits to chance. Historically, this stock follows specific seasonal patterns that institutional traders use to maximize returns.
- ✅ Identify the "Golden Buying Window"
- ✅ Avoid high-risk correction cycles
- ✅ Backtested data from the last 20+ years