February 15, 2026 a 11:31 am


ZTS: Dividend Analysis - Zoetis Inc.
Zoetis Inc. presents a compelling case for dividend investors with its stable dividend history and consistent growth. With a market capitalization of over $55 billion, it establishes itself as a robust player in the pharmaceuticals sector. The company's strategic financial management underscores its ability to sustain and grow dividends, making it a potentially rewarding investment for long-term income-focused investors.
📊 Overview
Zoetis operates within the Pharmaceuticals sector, an industry known for its resilience and growth potential. The company's current dividend yield stands at 1.63%, and it offers a dividend of 2.00 USD per share. With a 14-year history of dividends and no recent cuts or suspensions, Zoetis demonstrates a commendable commitment to returning value to its shareholders.
| Attribute | Details |
|---|---|
| Sector | Pharmaceuticals |
| Dividend yield | 1.63% |
| Current dividend per share | 2.00 USD |
| Dividend history | 14 years |
| Last cut or suspension | None |
🗣️ Dividend History
Understanding a company's dividend history is crucial in identifying its commitment to returning capital to shareholders. Zoetis's 14-year dividend history reflects its resilience in maintaining payouts, which is significant for trust among investors.
| Year | Dividend per Share (USD) |
|---|---|
| 2026 | 1.06 |
| 2025 | 2.00 |
| 2024 | 1.728 |
| 2023 | 1.500 |
| 2022 | 1.300 |
📈 Dividend Growth
Consistent dividend growth indicates a healthy financial position and positive future prospects. Over the last 3 years, Zoetis has achieved a 15.44% growth rate, compared to a 20.11% growth over the past 5 years. This progression illustrates a steady and sustainable dividend policy.
| Time | Growth |
|---|---|
| 3 years | 15.44% |
| 5 years | 20.11% |
The average dividend growth is 20.11% over 5 years. This shows moderate but steady dividend growth.
⚠️ Payout Ratio
Payout ratios provide insights into the sustainability of dividend payments. An EPS-based payout ratio of 33.49% and a free cash flow-based payout ratio of 39.44% are indicative of a comfortably sustainable dividend strategy, allowing room for reinvestments and further growth.
| Key Figure | Ratio |
|---|---|
| EPS-based | 33.49% |
| Free cash flow-based | 39.44% |
Such levels indicate that Zoetis is well-positioned to maintain its dividend payments while still having substantial capital for other strategic uses.
✅ Cashflow & Capital Efficiency
Robust cash flow metrics and capital efficiency ensure that Zoetis can fund its dividend payments and strategic initiatives without sacrificing financial stability.
| Year | 2025 | 2024 | 2023 |
|---|---|---|---|
| Free Cash Flow Yield | 4.09% | 3.11% | 1.78% |
| Earnings Yield | 4.79% | 3.36% | 2.58% |
| CAPEX to Operating Cash Flow | 21.38% | 22.18% | 31.11% |
| Stock-based Compensation to Revenue | 0.88% | 0.80% | 0.70% |
| Free Cash Flow / Operating Cash Flow Ratio | 78.62% | 77.82% | 68.89% |
Zoetis's efficient capital utilization and cash flow generation underpin its ability to maintain financial flexibility and navigate economic fluctuations.
📉 Balance Sheet & Leverage Analysis
A strong balance sheet with minimal leverage offers a cushion against adverse economic conditions, sustaining the company’s operations and dividends predictably.
| Year | 2025 | 2024 | 2023 |
|---|---|---|---|
| Debt-to-Equity | 0.06 | 1.41 | 1.35 |
| Debt-to-Assets | 0.01 | 0.47 | 0.47 |
| Debt-to-Capital | 0.06 | 0.59 | 0.57 |
| Net Debt to EBITDA | - | 1.23 | 1.28 |
| Current Ratio | 3.03 | 1.75 | 3.36 |
| Quick Ratio | 1.94 | 1.08 | 2.00 |
| Financial Leverage | 4.64 | 2.98 | 2.86 |
Zoetis's low leverage and healthy current and quick ratios indicate strong financial solvency, ensuring stability and opportunities for future growth.
✅ Fundamental Strength & Profitability
The fundamental and profitability metrics reflect the operational efficiencies and the capacity to generate profit from investments, crucial for intrinsic value appreciation.
| Year | 2025 | 2024 | 2023 |
|---|---|---|---|
| Return on Equity | 80.25% | 52.12% | 46.91% |
| Return on Assets | 17.28% | 17.46% | 16.41% |
| Margins: Net | 28.23% | 26.86% | 27.43% |
| Margins: EBIT | - | 36.46% | 37.38% |
| Margins: EBITDA | - | 41.83% | 43.13% |
| Research & Development to Revenue | 7.37% | 7.41% | 7.19% |
High rates of return and stable margins underscore Zoetis's robust profitability and efficiency in utilizing its resources.
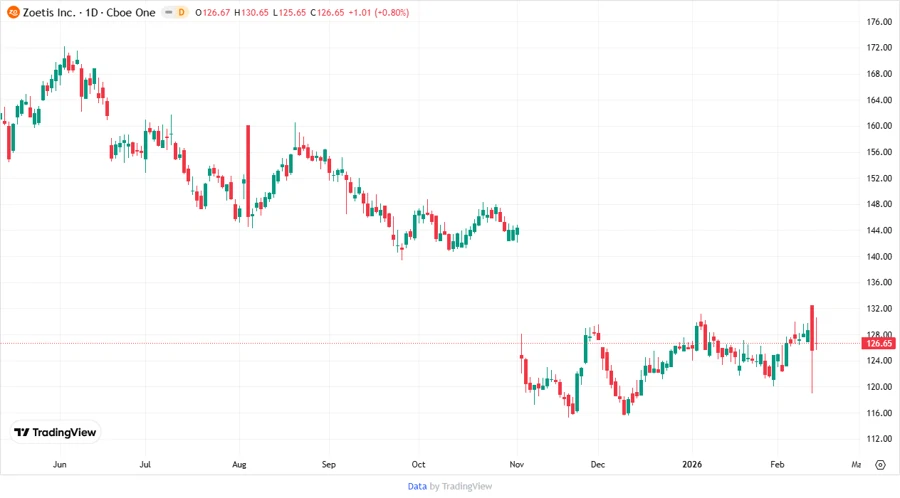
⚠️ Price Development
🏆 Dividend Scoring System
| Category | Score | Score Bar |
|---|---|---|
| Dividend yield | 3 | |
| Dividend Stability | 5 | |
| Dividend growth | 4 | |
| Payout ratio | 4 | |
| Financial stability | 5 | |
| Dividend continuity | 5 | |
| Cashflow Coverage | 4 | |
| Balance Sheet Quality | 5 |
Total Score: 35/40
⚖️ Rating
Zoetis Inc. holds a strong position in maintaining high dividend stability and moderate growth. The overall financial health and prudent capital management make it an excellent choice for investors seeking both income and growth. The strong cash flow and payout ratios reinforce its capability to sustain dividends, earning a positive long-term outlook.
Smart Data Insight
Master the Perfect Entry & Exit for this Stock
Don't leave your profits to chance. Historically, this stock follows specific seasonal patterns that institutional traders use to maximize returns.
- ✅ Identify the "Golden Buying Window"
- ✅ Avoid high-risk correction cycles
- ✅ Backtested data from the last 20+ years