January 16, 2026 a 09:03 am

ZBRA: Trend and Support & Resistance Analysis - Zebra Technologies Corporation
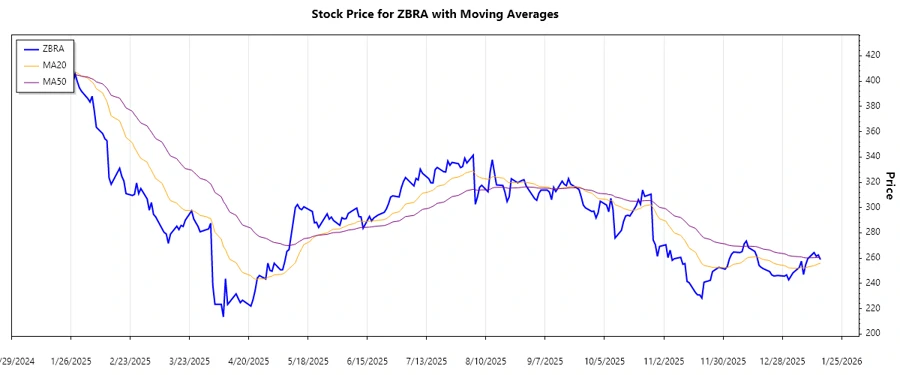
Zebra Technologies Corporation (ZBRA) provides comprehensive enterprise asset intelligence solutions. The stock has shown an overall volatility, with significant shifts occurring over the observed period. Recent trends suggest a downward movement, but analysis of the EMAs could indicate potential stabilization or reversal zones. Analysts should observe potential support and resistance areas for future strategy adaptations.
Trend Analysis
| Date | Closing Price | Trend |
|---|---|---|
| 2026-01-15 | 258.85 | ▼ Abwärtstrend |
| 2026-01-14 | 262.51 | ▼ Abwärtstrend |
| 2026-01-13 | 261.44 | ▼ Abwärtstrend |
| 2026-01-12 | 264.43 | ▼ Abwärtstrend |
| 2026-01-09 | 259.48 | ▼ Abwärtstrend |
| 2026-01-08 | 254.64 | ▼ Abwärtstrend |
| 2026-01-07 | 246.96 | ▼ Abwärtstrend |
Overall, the trend depicted by the EMA calculations (EMA20 < EMA50) illustrates an ongoing bearish movement. Investors should monitor these signals for potential trend reversals.
Support and Resistance
| Zone Type | From | To |
|---|---|---|
| Support 1 | 240.00 | 245.00 |
| Support 2 | 250.00 | 255.00 |
| Resistance 1 | 265.00 | 270.00 |
| Resistance 2 | 275.00 | 280.00 |
Currently, the stock is fluctuating near the second support zone (250.00 - 255.00), indicating potential support where buying interest might resurface.
Conclusion
The overall downtrend in ZBRA's stock, as shown by the EMA20 being lower than EMA50, suggests ongoing pressure on the stock price. Potential rebounds might emerge from the identified support zones, which offer strategic points for entering long positions. Conversely, resistance levels provide insights on possible profit-taking or an area of caution for potential short positions. Monitoring the stock’s behavior around these levels could provide valuable insights for future investment decisions.