December 07, 2025 a 02:03 pm

ZBRA: Trend and Support & Resistance Analysis - Zebra Technologies Corporation
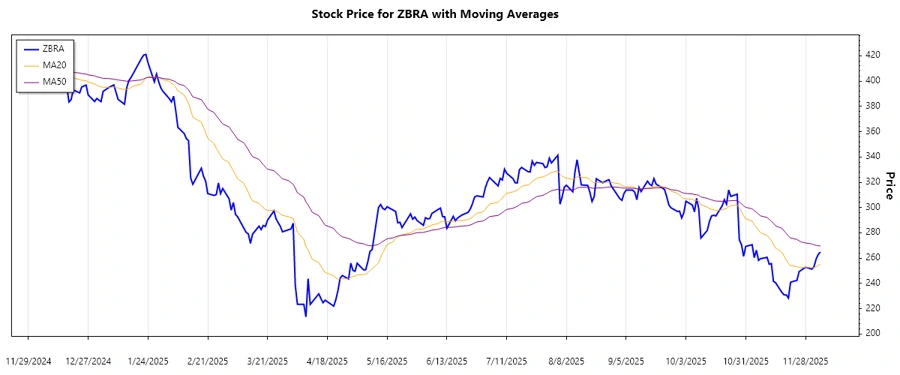
The stock of Zebra Technologies Corporation, in recent months, shows a trend where prices have consolidated after an initial surge. Analyzing the daily closing prices, there appears to be a short-term downward trend, influenced by external market conditions and company-specific factors in its industry. Despite challenges, Zebra Technologies maintains a robust position with its diverse offerings in asset intelligence and automatic data capture solutions. The technical analysis indicates potential support levels that investors may consider when evaluating buying opportunities.
Trend Analysis
An analysis of the closing prices and calculated EMAs over the recent period indicates a ▼ downward trend. The EMA20 has consistently been below the EMA50, signaling bearish sentiment. This trend appears to be stabilizing, with recent price action showing signs of consolidation.
| Date | Close | Trend |
|---|---|---|
| 2025-12-05 | 264.81 | ▼ |
| 2025-12-04 | 263.05 | ▼ |
| 2025-12-03 | 259.34 | ▼ |
| 2025-12-02 | 253.37 | ▼ |
| 2025-12-01 | 251.29 | ▼ |
| 2025-11-28 | 252.75 | ▼ |
| 2025-11-26 | 250.5 | ▼ |
In conclusion, the persistent downward trend, as depicted by the EMAs, suggests continued caution. Investors should monitor key support levels for potential entry points.
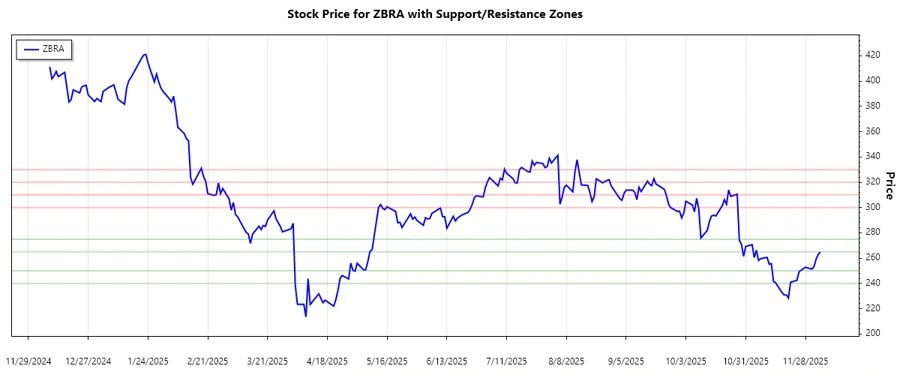
Support and Resistance
The technical analysis of recent closing prices reveals potential support and resistance zones. These zones are calculated based on historical price reactions and can serve as psychological barriers in trading.
| Type | Range |
|---|---|
| Support 1 | 240.00 - 250.00 ▲ |
| Support 2 | 265.00 - 275.00 ▲ |
| Resistance 1 | 300.00 - 310.00 ▼ |
| Resistance 2 | 320.00 - 330.00 ▼ |
The current price is situated near the lower support range, indicating possible stabilization around this level. This zone may attract buyers looking for value.
Conclusion
In summary, Zebra Technologies Corporation exhibits a short-term downward trend, as indicated by the EMA cross. However, it shows promising potential through its strategic market position and diverse solutions. The support and resistance zones identified could guide investors in making informed decisions. Opportunities may arise as the stock consolidates near key support levels, offering potential buying points. Considering market conditions and the company's operational strengths, the stock remains an interesting prospect for both risk-averse and growth-seeking investors.