
July 17, 2026 a 07:43 pm
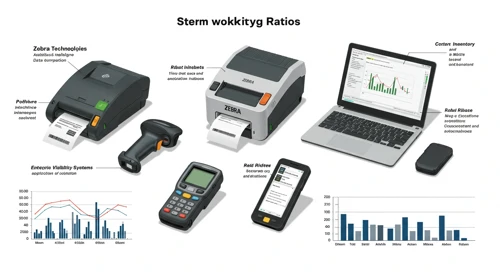

ZBRA: Fundamental Ratio Analysis - Zebra Technologies Corporation
Zebra Technologies Corporation, with a strong presence in the AIDC sector, offers robust enterprise asset intelligence solutions. Despite challenges in debt-to-equity, their industry positioning and diversified product offerings provide resilience. The current market sentiment reflects steady buy-side interest, albeit with a cautious approach to growth metrics.
Fundamental Rating
Zebra Technologies has shown moderate strength across several key financial ratios, indicating solid stability with room for improvement in certain financial policies.
| Category | Score | Visual |
|---|---|---|
| Discounted Cash Flow | 3 | |
| Return on Equity | 3 | |
| Return on Assets | 3 | |
| Debt to Equity | 1 | |
| Price to Earnings | 2 | |
| Price to Book | 3 |
Historical Rating
The historical ratings show a consistency in financial evaluation, with potential slight lift in future prospects.
| Date | Overall Score | DCF | ROE | ROA |
|---|---|---|---|---|
| 2026-07-17 | 3 | 3 | 3 | 3 |
| Previous | 0 | 3 | 3 | 3 |
Analyst Price Targets
Analyst price targets reflect steady growth potential, with median expectations aligning closely with the consensus.
| High | Low | Median | Consensus |
|---|---|---|---|
| $346 | $296 | $317 | $318.86 |
Analyst Sentiment
The current analyst sentiment leans towards a positive outlook, with a predominant portion recommending a 'Buy'.
| Recommendation | Number | Visual |
|---|---|---|
| Strong Buy | 0 | |
| Buy | 19 | |
| Hold | 8 | |
| Sell | 0 | |
| Strong Sell | 0 |
Conclusion
Zebra Technologies presents a mixed investment opportunity with some strong fundamental signals among industry peers. The stability in analyst evaluations suggests confidence in their operational strategies. However, their debt-to-equity ratio remains a concern that investors need to monitor closely. Overall, while the current analyst sentiment supports purchasing, potential investors should consider market conditions and company developments. Remaining attentive to industry shifts and the company’s strategic financial adjustments will be crucial.
Smart Data Insight
Master the Perfect Entry & Exit for this Stock
Don't leave your profits to chance. Historically, this stock follows specific seasonal patterns that institutional traders use to maximize returns.
- ✅ Identify the "Golden Buying Window"
- ✅ Avoid high-risk correction cycles
- ✅ Backtested data from the last 20+ years