
July 07, 2026 a 08:00 am

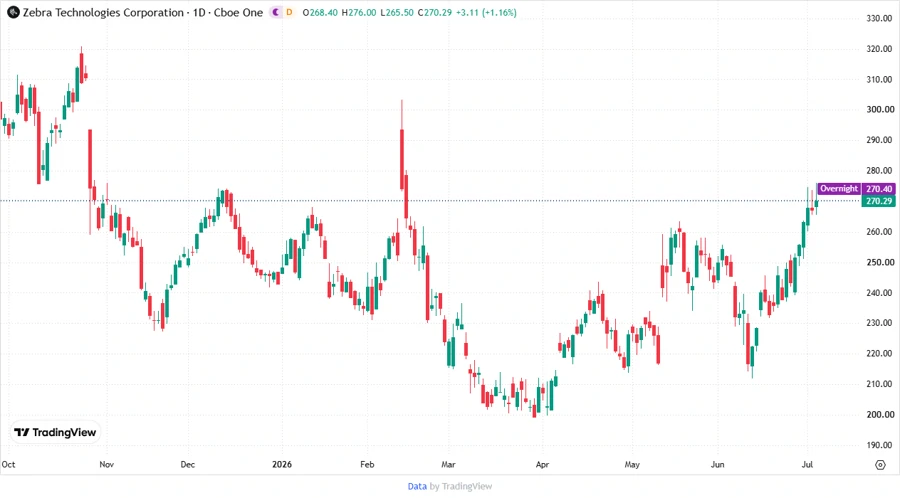
ZBRA: Fundamental Ratio Analysis - Zebra Technologies Corporation
Zebra Technologies Corporation offers robust enterprise asset intelligence solutions globally. With a diverse portfolio in the AIDC sector, Zebra is well-received in various industries such as retail, healthcare, and logistics. The stock presents a decent growth potential but may face challenges in the highly competitive market landscape.
Fundamental Rating
The fundamental rating of Zebra Technologies Corporation reflects a stable performance with room for improvement, particularly in its debt management.
| Metric | Rating | Score |
|---|---|---|
| Discounted Cash Flow | B- | |
| Return on Equity | B- | |
| Return on Assets | B- | |
| Debt to Equity | C | |
| Price to Earnings | C+ | |
| Price to Book | B- |
Historical Rating
Recent scores indicate certain consistency, although investors might note how these figures have evolved over time.
| Date | Overall | DCF | ROE | ROA | D/E | P/E | P/B |
|---|---|---|---|---|---|---|---|
| 2026-07-06 | 3 | 3 | 3 | 3 | 1 | 2 | 3 |
| Today | 3 | 3 | 3 | 3 | 1 | 2 | 3 |
Analyst Price Targets
Analysts present optimistic targets, with a balanced outlook reflecting both bullish and conservative predictions.
| High | Low | Median | Consensus |
|---|---|---|---|
| $346 | $296 | $316.5 | $319.17 |
Analyst Sentiment
The sentiment remains positive with a majority leaning towards buying recommendations.
| Recommendation | Count | Distribution |
|---|---|---|
| Strong Buy | 0 | |
| Buy | 19 | |
| Hold | 8 | |
| Sell | 0 | |
| Strong Sell | 0 |
Conclusion
Zebra Technologies Corporation maintains a stable financial condition with a favorable growth outlook. While the debt-to-equity ratio points to certain financial leverage concerns, consistent revenue streams across its broad industrial base offer resilience. Analysts largely support a buy strategy, despite some market risks due to competition and sector dynamics. Investors should watch macroeconomic factors influencing tech stocks yet consider Zebra's innovation-driven advantages. Overall, ZBRA presents as a solid long-term investment with prudent risk management.
Smart Data Insight
Master the Perfect Entry & Exit for this Stock
Don't leave your profits to chance. Historically, this stock follows specific seasonal patterns that institutional traders use to maximize returns.
- ✅ Identify the "Golden Buying Window"
- ✅ Avoid high-risk correction cycles
- ✅ Backtested data from the last 20+ years