November 22, 2025 a 05:15 am

ZBRA: Fibonacci Analysis - Zebra Technologies Corporation
Zebra Technologies Corporation has shown resilience in the enterprise asset intelligence solutions market, with strengths in its RFID and barcode solutions across industries. The recent market movements suggest investors' confidence remains steady, although the stock experienced some volatility. As Zebra Technologies continues to expand its product and service offerings, it remains a key player in enabling operational efficiency in various sectors.
Fibonacci Analysis
| Data Point | Value |
|---|---|
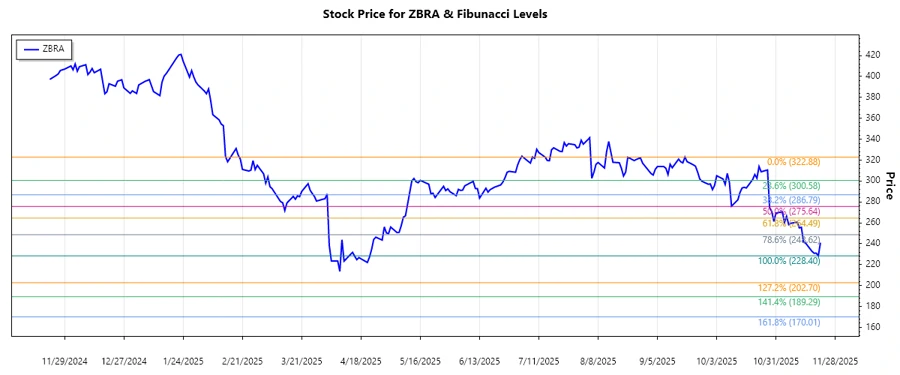
| Start Date | 2025-09-19 |
| End Date | 2025-11-21 |
| High Price (Date) | 322.88 (2025-09-18) |
| Low Price (Date) | 228.4 (2025-11-20) |
| 0.236 Level | 248.41 |
| 0.382 Level | 262.65 |
| 0.5 Level | 275.64 |
| 0.618 Level | 288.63 |
| 0.786 Level | 306.60 |
The current price is within the 0.236 retracement zone, suggesting a potential area of support. This indicates possible investor re-entry, which could lead to an upward price correction.
Conclusion
In conclusion, Zebra Technologies Corporation is navigating through a broader market downtrend. The Fibonacci levels indicate critical support areas, such as the 0.236 retracement, where the stock may experience a rebound. However, a sustained break below these levels could signal further downside potential. Analysts should watch the 0.382 and 0.5 Fibonacci levels closely for potential trend reversals. The company's growth in cloud-based and automated robotics solutions offers long-term opportunities, although short-term volatility remains a risk. Investors may find strategic buying opportunities as the market stabilizes.
Smart Data Insight
Master the Perfect Entry & Exit for this Stock
Don't leave your profits to chance. Historically, this stock follows specific seasonal patterns that institutional traders use to maximize returns.
- ✅ Identify the "Golden Buying Window"
- ✅ Avoid high-risk correction cycles
- ✅ Backtested data from the last 20+ years