August 25, 2025 a 05:15 am

ZBRA: Fibonacci Analysis - Zebra Technologies Corporation
Zebra Technologies Corporation is at the forefront of enterprise asset intelligence. The stock analysis indicates a significant price movement over the analyzed period. Investors should consider the identified trends and retracement levels to evaluate potential entry and exit points. The company's diverse product range in RFID, barcode scanning, and tracking could position it well in the growing market of enterprise solutions.
Fibonacci Analysis
| Details | Information | ||||||||||||
|---|---|---|---|---|---|---|---|---|---|---|---|---|---|
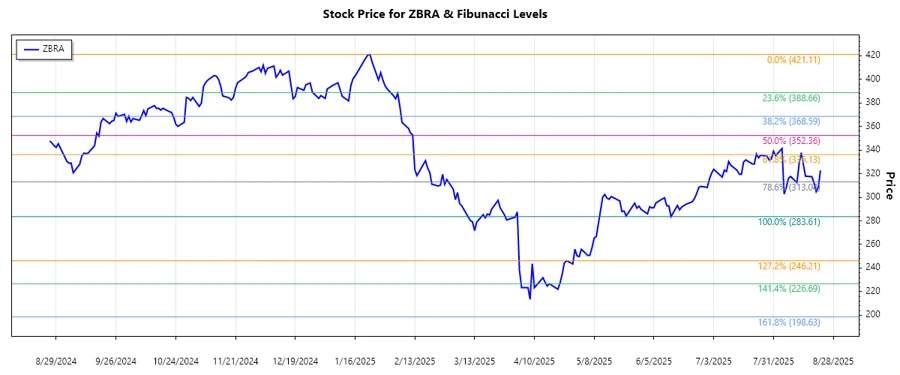
| Trend Period | From 2025-01-23 to 2025-08-22 | ||||||||||||
| High Point | $421.11 on 2025-01-23 | ||||||||||||
| Low Point | $283.61 on 2025-06-13 | ||||||||||||
| Fibonacci Levels |
|
||||||||||||
| Current Price | $322.79 | ||||||||||||
| Retracement Zone | None | ||||||||||||
| Technical Interpretation | The current price is below the 0.236 Fibonacci level, indicating limited upward momentum at the moment. This suggests potential resistance at higher levels unless a breakout occurs. |
Conclusion
Zebra Technologies Corporation's stock is currently experiencing downward pressure just below the 0.236 retracement level. While the company's market share in enterprise solutions continues to grow, the current price position indicates potential short-term hurdles. For analysts, careful monitoring of the market's response to fiscal policies and competitive innovations is essential. Investors should weigh the likelihood of support being established as trading patterns emerge and develop strategies accordingly. There exists a risk of further downside if significant resistance persists.
Smart Data Insight
Master the Perfect Entry & Exit for this Stock
Don't leave your profits to chance. Historically, this stock follows specific seasonal patterns that institutional traders use to maximize returns.
- ✅ Identify the "Golden Buying Window"
- ✅ Avoid high-risk correction cycles
- ✅ Backtested data from the last 20+ years