November 06, 2025 a 01:15 pm
ZBH: Trend and Support & Resistance Analysis - Zimmer Biomet Holdings, Inc.
Zimmer Biomet Holdings, Inc. operates in the musculoskeletal healthcare business globally with cutting-edge orthopedic and reconstructive solutions. This analysis assesses the recent trend and identifies key support and resistance zones in an ever-changing market environment. As the company continues to innovate, understanding these financial markers is crucial for potential investors and stakeholders.
Trend Analysis
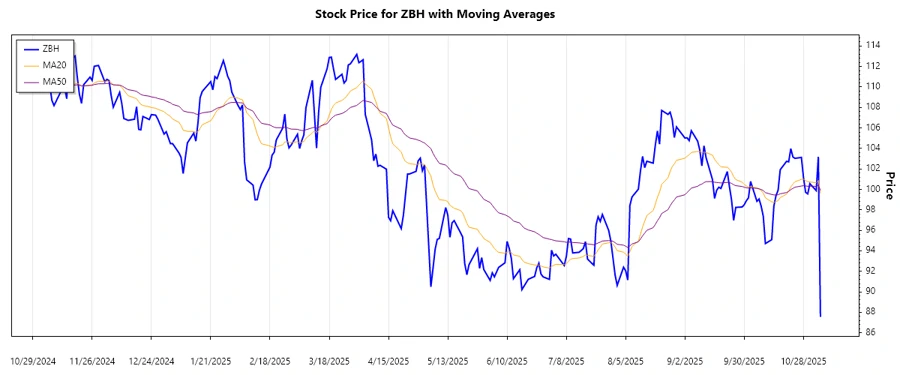
The analysis of historical price data for Zimmer Biomet Holdings, Inc. reveals recent fluctuations. With the EMAs developed from the closing prices, we observe that the EMA20 is slightly above EMA50, suggesting a minor ▲ uptrend.
| Date | Close Price | Trend |
|---|---|---|
| 2025-11-05 | $87.55 | ▼ |
| 2025-11-04 | $103.18 | ▲ |
| 2025-11-03 | $99.88 | ▼ |
| 2025-10-31 | $100.56 | ⚖️ |
| 2025-10-30 | $99.56 | ▼ |
| 2025-10-29 | $99.71 | ⚖️ |
| 2025-10-28 | $101.14 | ▲ |
Based on this analysis, Zimmer Biomet Holdings exhibits a subtle upward momentum but with significant fluctuations. This indicates potential trading opportunities, but caution is advised due to potential volatility.
Support and Resistance
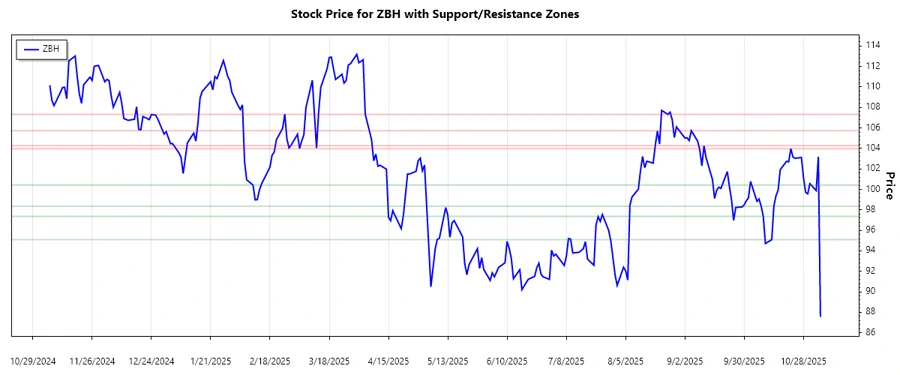
The support and resistance analysis reveals critical zones where the stock price might significantly react. Support zones are located between $95.09 - $97.37 and $98.36 - $100.42. Resistance zones are identified at $103.98 - $104.26 and $105.73 - $107.32.
| Zone | From | To |
|---|---|---|
| Support 1 | $95.09 | $97.37 |
| Support 2 | $98.36 | $100.42 |
| Resistance 1 | $103.98 | $104.26 |
| Resistance 2 | $105.73 | $107.32 |
The current close price is within this range, signaling possible support dynamics at play. Traders are recommended to monitor these zones for breakouts or pullbacks, aligning their strategies with these insights.
Conclusion
The trend analysis indicates that Zimmer Biomet Holdings, Inc. is experiencing a weak upward momentum with notable fluctuations. The stock currently tests support levels, offering a potential buying opportunity. However, investors should be cautious due to market volatility. The determination of trend, support, and resistance zones provides a structured basis for decision-making, helping traders to strategically navigate potential market movements. Overall, the company’s solid reputation and industry position remain positive indicators in the long term, but short-term risks exist due to recent market behavior.