September 22, 2025 a 05:15 am
ZBH: Fibonacci Analysis - Zimmer Biomet Holdings, Inc.
Zimmer Biomet Holdings, Inc. has demonstrated resilience within the musculoskeletal healthcare sector, covering a wide range of orthopaedic reconstructive products. Given recent market conditions, its stock, ZBH, has shown a significant trend. Investors should be mindful of the critical price levels this analysis will highlight, offering possible entry or exit points. This detailed Fibonacci retracement analysis will provide a clearer picture of the stock’s future movements.
Fibonacci Analysis
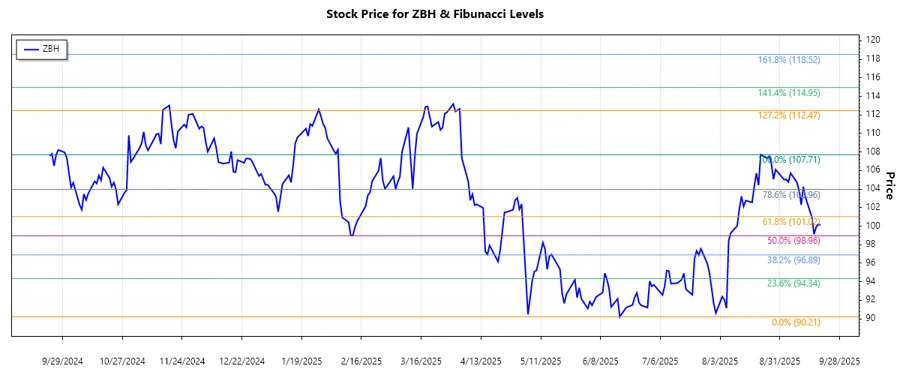
Analyzing the historical price data for Zimmer Biomet Holdings, Inc., we recognize a dominant upward trend from late March to late August 2025. The stock experienced a substantial rise from its low in late June to its peak in late August.
| Analysis | Details |
|---|---|
| Trend Start Date | 2025-06-18 |
| Trend End Date | 2025-08-28 |
| High Point | $107.71 on 2025-08-21 |
| Low Point | $90.21 on 2025-06-17 |
| Fibonacci Level | Price ($) |
|---|---|
| 0.236 | 94.18 |
| 0.382 | 97.12 |
| 0.5 | 98.96 |
| 0.618 | 100.80 |
| 0.786 | 103.21 |
The current trading price of $100.09 falls within the 0.5 and 0.618 retracement zone. This suggests that ZBH might be experiencing a temporary price consolidation within this range. The 0.618 level could serve as a strong resistance point, or if breached, signal further upward potential.
Conclusion
Zimmer Biomet's stock has shown promising upward movement over recent months. Should the stock maintain its position above critical Fibonacci retracement levels, it may attract bullish sentiment, signaling further growth potential. However, failure to break key resistance points could denote consolidation or reversal. Investors should watch for volume shifts and confirm breaks through resistance to evaluate further investment opportunities. Analysts will find these levels crucial in forecasting future price movements and market sentiment.
Smart Data Insight
Master the Perfect Entry & Exit for this Stock
Don't leave your profits to chance. Historically, this stock follows specific seasonal patterns that institutional traders use to maximize returns.
- ✅ Identify the "Golden Buying Window"
- ✅ Avoid high-risk correction cycles
- ✅ Backtested data from the last 20+ years