August 21, 2025 a 10:15 am

ZBH: Fibonacci Analysis - Zimmer Biomet Holdings, Inc.
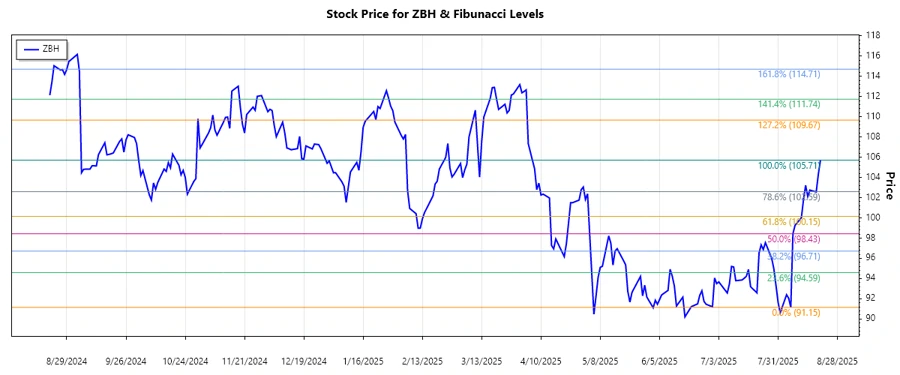
An analysis of the stock price trends of Zimmer Biomet Holdings, Inc. shows perhaps a significant inflection within the last several months. This analysis utilizes Fibonacci retracement to provide critical price levels which may serve as potential support or resistance. Such frameworks help investors anticipate price movements and make informed decisions.
Fibonacci Analysis
| Information | Details |
|---|---|
| Trend Start Date | 2025-08-06 |
| Trend End Date | 2025-08-20 |
| Highest Price | $105.71 on 2025-08-20 |
| Lowest Price | $91.15 on 2025-08-06 |
Fibonacci Levels
| Level | Price |
|---|---|
| 0.236 | $94.8 |
| 0.382 | $96.79 |
| 0.5 | $98.43 |
| 0.618 | $100.06 |
| 0.786 | $102.13 |
The current price of $105.71 as of 2025-08-20 suggests the stock is above the 0.786 Fibonacci retracement level, indicating a potential strengthened upward trend. Technically, this signals a continued bullish momentum with potential support levels at previously calculated Fibonacci retracement levels.
Conclusion
Zimmer Biomet Holdings, Inc. has shown a noticeable trend upward development over the analyzed months. The stock's recent price levels, surpassing significant Fibonacci levels, underline potential bullish momentum. Investors might see these levels as potential points of resistance or support, influencing future trading decisions. Assessments suggest robust fundamentals, though market conditions can alter. Keeping abreast with news affecting healthcare sectors may also provide insights.
Smart Data Insight
Master the Perfect Entry & Exit for this Stock
Don't leave your profits to chance. Historically, this stock follows specific seasonal patterns that institutional traders use to maximize returns.
- ✅ Identify the "Golden Buying Window"
- ✅ Avoid high-risk correction cycles
- ✅ Backtested data from the last 20+ years