
June 10, 2026 a 11:31 am

ZBH: Dividend Analysis - Zimmer Biomet Holdings, Inc.
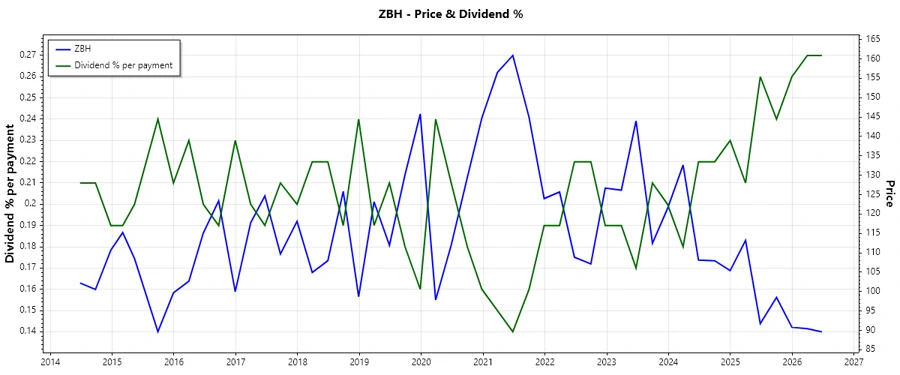
Zimmer Biomet Holdings, Inc. presents an interesting dividend profile with a moderate current yield of 1.07%. The company maintains a history of dividend payments spanning 15 years, with no recent cuts or suspensions. However, the dividend growth is negligible, which may indicate stability over aggressive expansion. Investors seeking steady, albeit modest income may find ZBH's dividend strategy fitting, complemented by a conservative payout ratio. Caution is advised given the zero dividend growth over recent years.
📊 Overview
Zimmer Biomet operates within the medical device sector. Offering a dividend yield of 1.07%, the company provides a current dividend of $0.96 per share. Its strong history of dividends over 15 years adds to its credibility, although there has been no significant dividend growth recently. The absence of recent cuts or suspensions contributes to its image as a stable payer.
| Metric | Value |
|---|---|
| Sector | Medical Devices |
| Dividend yield | 1.07% |
| Current dividend per share | $0.96 |
| Dividend history | 15 years |
| Last cut or suspension | None |
🔍 Dividend History
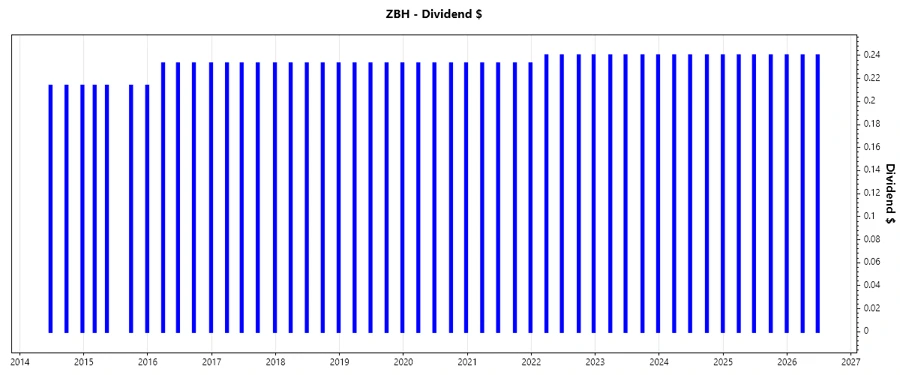
The long-standing tradition of dividend payments bolsters investor confidence, illustrating a commitment to shareholder returns. A consistent history can be appealing for income-focused investors but may signal a lack of growth in challenging economic environments.
| Year | Dividend per Share (USD) |
|---|---|
| 2026 | $0.48 |
| 2025 | $0.96 |
| 2024 | $0.96 |
| 2023 | $0.96 |
| 2022 | $0.96 |
📈 Dividend Growth
Analyzing dividend growth helps understand future income potential and company reinvestment strategies. Zimmer Biomet shows negligible growth, underscoring a focus more on stability than expansion.
| Time | Growth |
|---|---|
| 3 years | 0% |
| 5 years | 0.59% |
The average dividend growth is 0.59% over 5 years. This shows moderate but steady dividend growth.
🔍 Payout Ratio
The payout ratio is a crucial indicator of dividend sustainability. Zimmer Biomet's EPS-based payout ratio of 24.62% and FCF-based ratio of 12.30% suggest a conservative payout strategy, effectively balancing income distribution and reinvestment.
| Key figure | Ratio |
|---|---|
| EPS-based | 24.62% |
| Free cash flow-based | 12.30% |
The low payout ratios indicate a safe margin for sustaining payouts even in less favourable market conditions.
💼 Cashflow & Capital Efficiency
Evaluation of cash flow stability and capital efficiency provides insights into the company’s financial health. With free cash flow yield being robust, Zimmer Biomet shows strong cash flow health, suggesting capability to meet obligations and invest in growth opportunities.
| Year | 2023 | 2024 | 2025 |
|---|---|---|---|
| Free Cash Flow Yield | 4.67% | 5.33% | 8.27% |
| Earnings Yield | 4.03% | 4.21% | 3.96% |
| CAPEX to Operating Cash Flow | 24.94% | 23.80% | 13.23% |
| Stock-based Compensation to Revenue | 1.35% | 1.32% | 0% |
| Free Cash Flow / Operating Cash Flow Ratio | 75.06% | 76.20% | 86.77% |
Strong cash flow yields and efficient deployment of capital indicate high operational efficiency and an ability to reinvest in growth.
💰 Balance Sheet & Leverage Analysis
Evaluating leverage ratios helps assess financial stability and the ability to withstand economic pressures. Zimmer Biomet maintains a moderate leverage level, indicating a balanced exposure to debt.
| Year | 2023 | 2024 | 2025 |
|---|---|---|---|
| Debt-to-Equity | 0.46 | 0.50 | 0.59 |
| Debt-to-Assets | 0.27 | 0.29 | 0.33 |
| Debt-to-Capital | 0.32 | 0.33 | 0.37 |
| Net Debt to EBITDA | 2.41 | 2.52 | 3.19 |
| Current Ratio | 1.61 | 1.91 | 1.98 |
| Quick Ratio | 0.78 | 0.99 | 1.10 |
| Financial Leverage | 1.72 | 1.71 | 1.82 |
While the leverage ratios are progressively increasing, they remain within acceptable thresholds, demonstrating financial flexibility and debt serviceability.
🔎 Fundamental Strength & Profitability
Assessing profitability is critical for understanding company efficiency. Zimmer Biomet shows stable returns on equity and assets, underlining its capability to generate earnings with shareholder funds effectively.
| Year | 2023 | 2024 | 2025 |
|---|---|---|---|
| Return on Equity | 8.20% | 7.25% | 5.55% |
| Return on Assets | 4.76% | 4.23% | 3.05% |
| Margins: Net | 13.85% | 11.77% | 8.57% |
| EBIT | 17.15% | 16.34% | 13.65% |
| EBITDA | 30.03% | 29.31% | 26.94% |
| Gross | 71.82% | 71.46% | 61.62% |
| Research & Development to Revenue | 6.20% | 5.70% | 5.57% |
Despite challenges, profitability ratios reflect resilience. Margins indicate efficient cost management, though maintaining growth through innovation remains crucial.
📉 Price Development
⚖️ Dividend Scoring System
An assessment across multiple dividend metrics reveals comprehensive insights into Zimmer Biomet’s dividend strategy, covering stability, growth, and financial health.
| Criteria | Score (1-5) | Score Bar |
|---|---|---|
| Dividend yield | 2 | |
| Dividend Stability | 4 | |
| Dividend growth | 1 | |
| Payout ratio | 5 | |
| Financial stability | 3 | |
| Dividend continuity | 5 | |
| Cashflow Coverage | 4 | |
| Balance Sheet Quality | 3 |
Total Score: 27 out of 40
✅ Rating
Zimmer Biomet Holdings, Inc. offers a reliable dividend profile, though with limited growth. Investors prioritizing income stability might find this stock preferable, albeit with modest yields. The company’s robust payout ratios and consistent dividend history underscore its capacity to maintain current levels. Overall, ZBH could be suitable for risk-averse investors focusing on stable income streams.
Smart Data Insight
Master the Perfect Entry & Exit for this Stock
Don't leave your profits to chance. Historically, this stock follows specific seasonal patterns that institutional traders use to maximize returns.
- ✅ Identify the "Golden Buying Window"
- ✅ Avoid high-risk correction cycles
- ✅ Backtested data from the last 20+ years