November 27, 2025 a 07:46 am

ZBH: Dividend Analysis - Zimmer Biomet Holdings, Inc.
Zimmer Biomet Holdings, Inc. shows a promising, albeit moderate, dividend growth potential with a yield that attracts income-focused investors. Despite a modest dividend yield, the firm's financials demonstrate a stable platform for ongoing dividend payments. Analyzing the payout ratios, financial stability and growth prospects will provide insight into its long-term dividend sustainability.
📊 Overview
A comprehensive overview of Zimmer Biomet Holdings, Inc. illustrates its position within the Health Care equipment sector. Investors are attracted by its stable historical dividend distributions and recent strategies aimed at enhancing shareholder value.
| Sector | Dividend Yield | Current Dividend Per Share | Dividend History | Last Cut or Suspension |
|---|---|---|---|---|
| Health Care | 0.97% | 0.97 USD | 14 years | None |
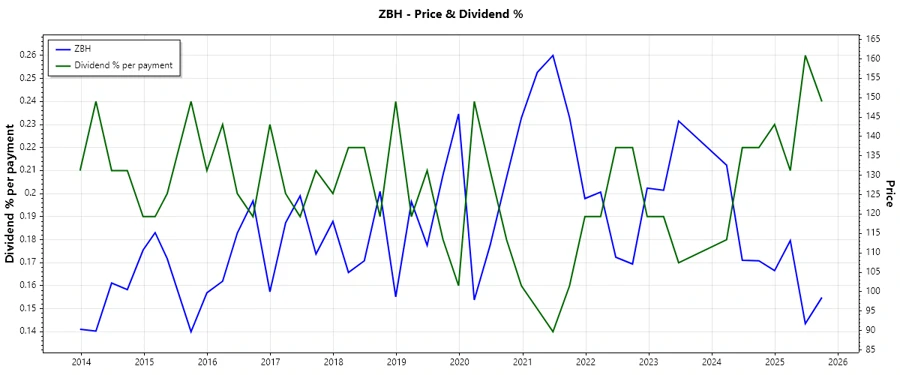
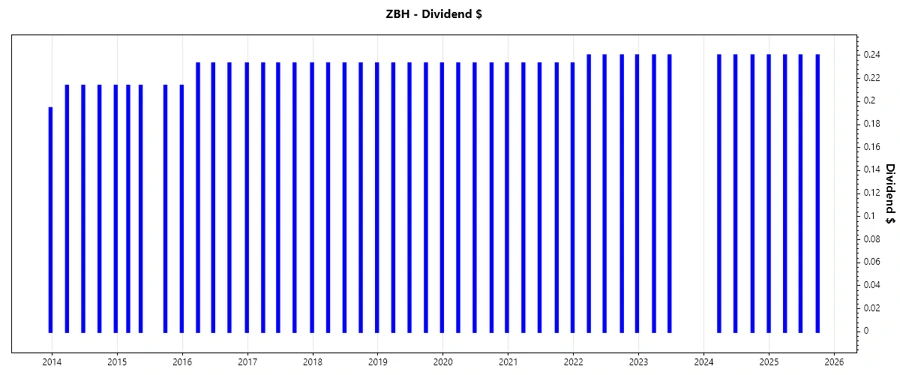
🗣️ Dividend History
The consistency in Zimmer Biomet's dividend payments over the past 14 years is a testament to its commitment to returning capital to shareholders. This reliable history builds investor confidence and indicates financial resilience in the face of market fluctuations.
| Year | Dividend Per Share (USD) |
|---|---|
| 2025 | 0.72 |
| 2024 | 0.96 |
| 2023 | 0.48 |
| 2022 | 0.96 |
| 2021 | 0.93204 |
📈 Dividend Growth
An evaluation of the dividend growth reveals minimal increases over the past few years, suggesting a focus on maintaining rather than aggressively growing payouts. This conservative approach may be appreciated by risk-averse investors.
| Time | Growth |
|---|---|
| 3 years | 0.99% |
| 5 years | 0.59% |
The average dividend growth is 0.59% over 5 years. This shows moderate but steady dividend growth.
✅ Payout Ratio
The payout ratios provide insight into the company's financial health and its capacity to sustain dividends. Zimmer Biomet maintains a conservative EPS-based payout ratio of 23.74%, signaling a sustainable payout level, while a 13.43% FCF-based ratio suggests efficient cash flow management to support dividends independently of earnings.
| Key Figure | Ratio |
|---|---|
| EPS-based | 23.74% |
| Free cash flow-based | 13.43% |
💰 Cashflow & Capital Efficiency
Evaluating cash flow and capital efficiency ensures understanding of Zimmer Biomet's operational success and sustainable dividends. Consistent FCF and efficient capital allocation can enhance shareholder returns over time.
| Key Metric | 2024 | 2023 | 2022 |
|---|---|---|---|
| Free Cash Flow Yield | 5.33% | 4.67% | 3.99% |
| Earnings Yield | 4.21% | 4.03% | 0.87% |
| CAPEX to Operating Cash Flow | 23.80% | 24.94% | 16.94% |
| Stock-based Compensation to Revenue | 1.32% | 1.35% | 1.51% |
| Free Cash Flow / Operating Cash Flow Ratio | 76.20% | 75.06% | 83.06% |
These metrics indicate stable cash flow management and capital allocation, essential for sustaining future dividends and operational investments.
📊 Balance Sheet & Leverage Analysis
Understanding leverage and liquidity is crucial for assessing long-term financial viability and the ability to withstand economic downturns. Zimmer Biomet’s balance sheet ratios provide a clear depiction of its financial stability.
| Key Metric | 2024 | 2023 | 2022 |
|---|---|---|---|
| Debt-to-Equity | 49.76% | 46.21% | 47.39% |
| Debt-to-Assets | 29.04% | 26.83% | 27.04% |
| Debt-to-Capital | 33.23% | 31.61% | 32.15% |
| Net Debt to EBITDA | 2.52 | 2.41 | 3.56 |
| Current Ratio | 1.91 | 1.61 | 1.88 |
| Quick Ratio | 0.99 | 0.77 | 0.97 |
| Financial Leverage | 1.71 | 1.72 | 1.75 |
The leverage levels indicate reasonable use of debt, maintaining operational flexibility and a strong liquidity position to support financial stability.
🧮 Fundamental Strength & Profitability
Zimmer Biomet's fundamental strength reflects its profitability, cost control, and efficiency measures. Achieving robust profitability ratios ensures market competitiveness and shareholder returns.
| Key Metric | 2024 | 2023 | 2022 |
|---|---|---|---|
| Return on Equity | 7.25% | 8.20% | 1.93% |
| Return on Assets | 4.23% | 4.76% | 1.10% |
| Margins: Net, EBIT, EBITDA, Gross | 11.77%, 16.34%, 29.31%, 71.46% | 13.85%, 17.16%, 30.03%, 71.82% | 3.33%, 8.19%, 21.54%, 70.90% |
| Research & Development to Revenue | 5.70% | 6.20% | 5.85% |
These profitability metrics underscore competitive efficiency and a potentially attractive investment proposition, providing confidence in Zimmer Biomet’s strategic financial allocation.
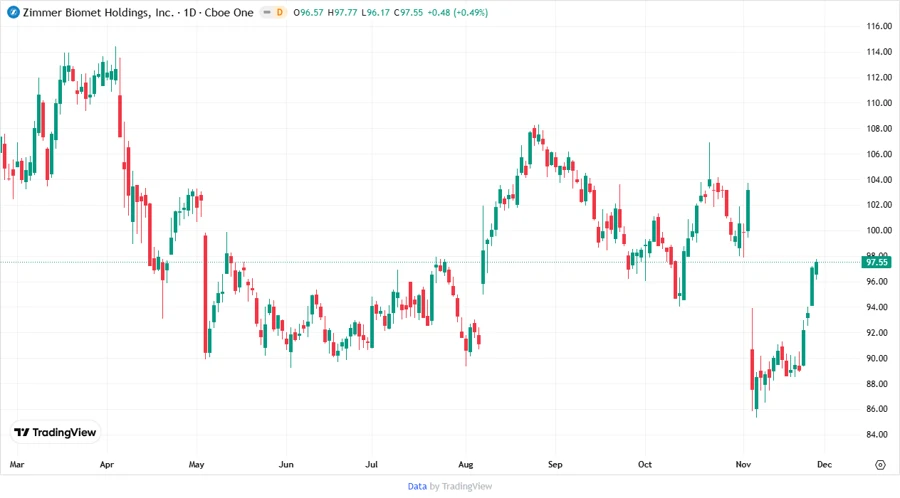
📉 Price Development
📝 Dividend Scoring System
The following scoring system evaluates Zimmer Biomet's dividend performance across essential criteria.
| Criteria | Score | Indicator |
|---|---|---|
| Dividend yield | 3 | |
| Dividend Stability | 4 | |
| Dividend growth | 2 | |
| Payout ratio | 4 | |
| Financial Stability | 5 | |
| Dividend continuity | 5 | |
| Cashflow Coverage | 4 | |
| Balance Sheet Quality | 4 |
Total Score: 31/40
🧐 Rating
In conclusion, Zimmer Biomet Holdings, Inc. demonstrates a commitment to maintaining and potentially growing its dividend. While the current yield may not lead the industry, steady financials and strategic management position it attractively for income and value investors. We recommend a cautious buy, contingent on individual risk preferences and portfolio diversification needs.