October 28, 2025 a 03:31 am

ZBH: Dividend Analysis - Zimmer Biomet Holdings, Inc.
Zimmer Biomet Holdings, Inc. offers a nominal dividend yield of approximately 0.97%, demonstrating moderate growth stability with a 5-year growth rate of around 0.59%. Despite its stable payout, the company’s potential for accelerating dividend growth could attract income-seeking investors.
Overview 📊
| Detail | Value |
|---|---|
| Sector | - |
| Dividend yield | 0.97% |
| Current dividend per share | 0.97 USD |
| Dividend history | 14 years |
| Last cut or suspension | None |
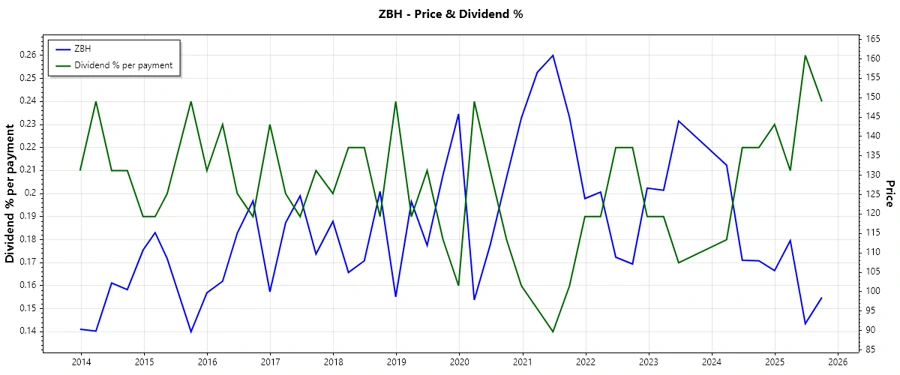
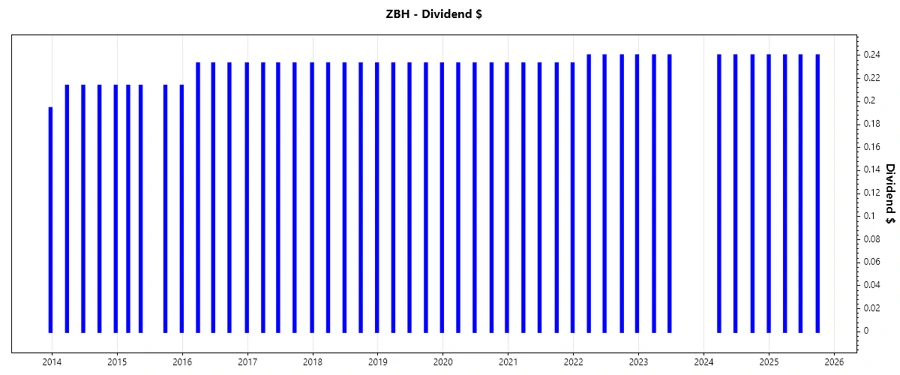
Dividend History 📉
The historical dividend payments for Zimmer Biomet Holdings provide insight into the company's commitment to maintaining a consistent dividend policy. Tracking dividend history is vital for assessing future payouts and understanding company priorities.
| Year | Dividend Per Share (USD) |
|---|---|
| 2025 | 0.72 |
| 2024 | 0.96 |
| 2023 | 0.48 |
| 2022 | 0.96 |
| 2021 | 0.93204 |
Dividend Growth 📈
The growth in dividends provides a compelling narrative about the company’s ability to increase shareholder value. This is particularly crucial for long-term investors focused on capital appreciation.
| Time | Growth |
|---|---|
| 3 years | 0.99% |
| 5 years | 0.59% |
The average dividend growth is 0.59% over 5 years. This shows moderate but steady dividend growth.
Payout Ratio ⚠️
The payout ratios offer insight into a company’s capacity to sustain its dividend. The EPS-based payout ratio is a vital indicator of sustainability and potential dividend growth.
| Key figure | Ratio |
|---|---|
| EPS-based | 23.19% |
| Free cash flow-based | 13.43% |
With an EPS payout ratio of 23.19%, and an FCF payout ratio of 13.43%, Zimmer Biomet illustrates a conservative distribution, leaving room for potential expansion in dividends without over-leveraging its earnings.
Cashflow & Capital Efficiency 💰
Understanding cash flow and capital efficiency metrics helps in evaluating the operational performance and efficiency of the company. These figures represent a firm's ability to generate cash to satisfy obligations, reinvest in the business, and issue dividends.
| Metric | 2024 | 2023 | 2022 |
|---|---|---|---|
| Free Cash Flow Yield | 5.33% | 4.67% | 3.99% |
| Earnings Yield | 4.21% | 4.03% | 0.87% |
| CAPEX to Operating Cash Flow | 23.80% | 24.94% | 16.93% |
| Stock-based Compensation to Revenue | 1.32% | 1.35% | 1.51% |
| Free Cash Flow / Operating Cash Flow Ratio | 76.20% | 75.06% | 83.06% |
Zimmer Biomet showcases a reliable cash flow management strategy. High FCF yield coupled with sustainable investment levels imply healthy operational cash for corporate activities and dividend coverage.
Balance Sheet & Leverage Analysis 🏦
Analyzing Zimmer Biomet's balance sheet offers an overview of financial leverage and the company's ability to manage its liabilities. A sound financial structure can enhance a company's resilience to market changes.
| Metric | 2024 | 2023 | 2022 |
|---|---|---|---|
| Debt-to-Equity | 0.50 | 0.46 | 0.47 |
| Debt-to-Assets | 0.29 | 0.27 | 0.27 |
| Debt-to-Capital | 0.33 | 0.32 | 0.32 |
| Net Debt to EBITDA | 2.52 | 2.41 | 3.56 |
| Current Ratio | 1.91 | 1.61 | 1.87 |
The stability observed in current and quick ratios highlights a robust liquidity position, providing Zimmer Biomet with enough buffers to handle short-term obligations effectively.
Fundamental Strength & Profitability 📊
Zimmer Biomet's fundamental strength is encapsulated in its profitability and returns, showcasing its capability to deliver sustained and competitive returns on investment.
| Metric | 2024 | 2023 | 2022 |
|---|---|---|---|
| Return on Equity | 7.25% | 8.20% | 1.93% |
| Return on Assets | 4.23% | 4.76% | 1.10% |
| Return on Invested Capital | 5.68% | 6.28% | 2.61% |
| Margins: Net | 11.77% | 13.85% | 3.33% |
| EBIT | 16.34% | 17.15% | 8.19% |
| EBITDA | 29.31% | 30.03% | 21.54% |
Consistent growth in ROE and ROIC exemplifies Zimmer Biomet's strategic focus on maximizing shareholder returns and maintaining profitable operations across market cycles.
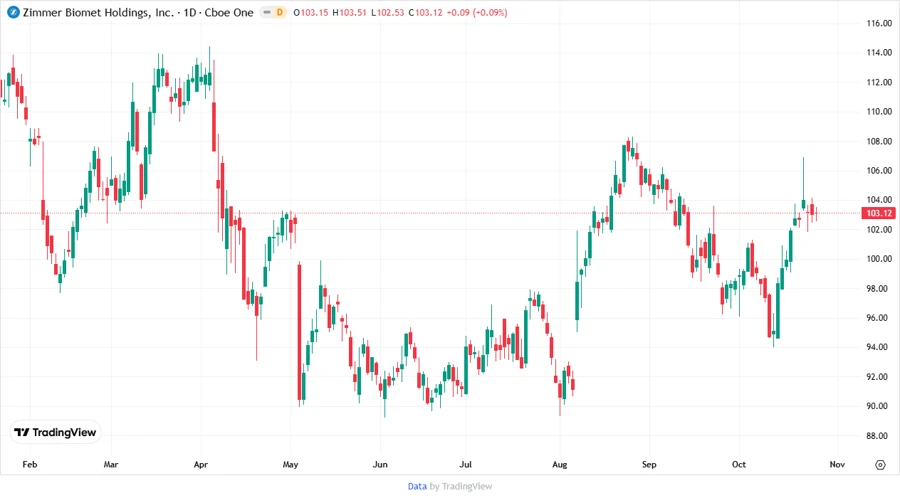
Price Development 📈
Dividend Scoring System ✅
| Category | Score | |
|---|---|---|
| Dividend yield | 3 | |
| Dividend Stability | 4 | |
| Dividend growth | 3 | |
| Payout ratio | 5 | |
| Financial stability | 4 | |
| Dividend continuity | 4 | |
| Cashflow Coverage | 4 | |
| Balance Sheet Quality | 4 |
Total Score: 31/40
Rating 🗣️
Zimmer Biomet Holdings, Inc. presents a stable dividend proposition with reasonable growth potential. Its conservative payout ratio and robust financial health suggest continued security for income-focused investors. The firm's solid liquidity position and consistent profitability further enhance its attractiveness as a reliable dividend payer, making it a potentially sound addition to a well-diversified income portfolio.
Smart Data Insight
Master the Perfect Entry & Exit for this Stock
Don't leave your profits to chance. Historically, this stock follows specific seasonal patterns that institutional traders use to maximize returns.
- ✅ Identify the "Golden Buying Window"
- ✅ Avoid high-risk correction cycles
- ✅ Backtested data from the last 20+ years