September 22, 2025 a 08:15 am
YUM: Trend and Support & Resistance Analysis - Yum! Brands, Inc.
Yum! Brands, Inc., a leading player in the quick service restaurant sector, operates globally under well-known brands like KFC, Pizza Hut, Taco Bell, and The Habit Burger Grill. The stock performance has shown resilience amidst fluctuating market conditions. Understanding current trends and potential support and resistance levels can offer insights into the stock's future movement.
Trend Analysis
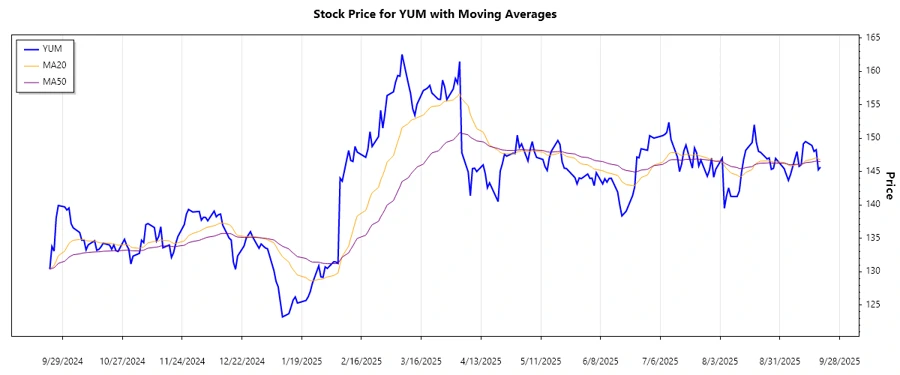
The recent analysis of Yum! Brands, Inc. (YUM) indicates that the stock is currently experiencing a slight downward trend. Calculated using EMA20 and EMA50, the prices suggest that EMA20 < EMA50, indicating a moderate bearish sign. Here's a concise overview:
| Date | Close Price | Trend |
|---|---|---|
| 2025-09-19 | 145.66 | ▼ |
| 2025-09-18 | 145.26 | ▼ |
| 2025-09-17 | 148.26 | ▲ |
| 2025-09-16 | 148.01 | ▲ |
| 2025-09-15 | 148.90 | ▲ |
| 2025-09-12 | 149.49 | ▲ |
| 2025-09-11 | 149.14 | ▼ |
The EMA analysis indicates a potential downtrend. Consistency in these trends over the near term bears watching for significant market moves.
Support and Resistance
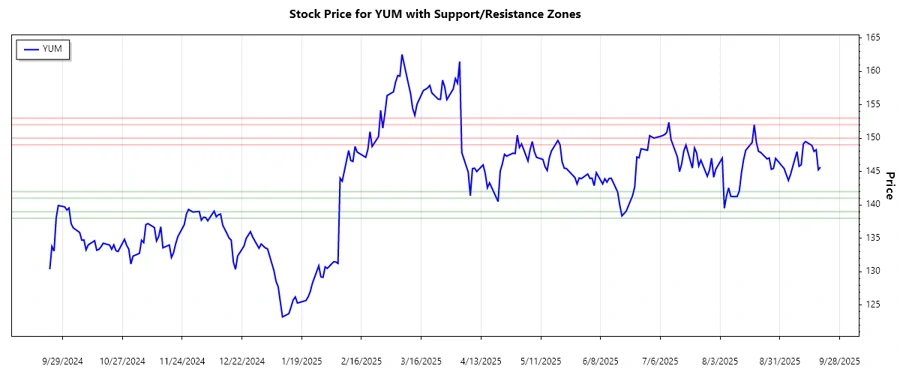
Support and resistance analysis reveals the following critical levels:
| Zone Type | From | To |
|---|---|---|
| Support Zone 1 | 141.00 | 142.00 |
| Support Zone 2 | 138.00 | 139.00 |
| Resistance Zone 1 | 149.00 | 150.00 |
| Resistance Zone 2 | 152.00 | 153.00 |
Currently, the price lingers near the first resistance zone, signifying a potential barrier for upward movement. Technical evaluation suggests monitoring these levels for breakout signals.
Conclusion
Yum! Brands, Inc.'s stock performance reflects a cautiously bearish outlook with the potential to test lower support levels. Investors should be aware of the crucial support and resistance zones identified to make informed trading decisions. While the current market movement showcases a gradual bearish trend, the company’s diverse brand portfolio offers a robust defense against market volatility. Analysts should remain vigilant of emerging patterns and leverage this technical analysis in strategic planning.
Smart Data Insight
Master the Perfect Entry & Exit for this Stock
Don't leave your profits to chance. Historically, this stock follows specific seasonal patterns that institutional traders use to maximize returns.
- ✅ Identify the "Golden Buying Window"
- ✅ Avoid high-risk correction cycles
- ✅ Backtested data from the last 20+ years